Rodeostat manufacturing & supply-chain issues
Rodeostat stock update, Environmental sensor project update and preliminary data
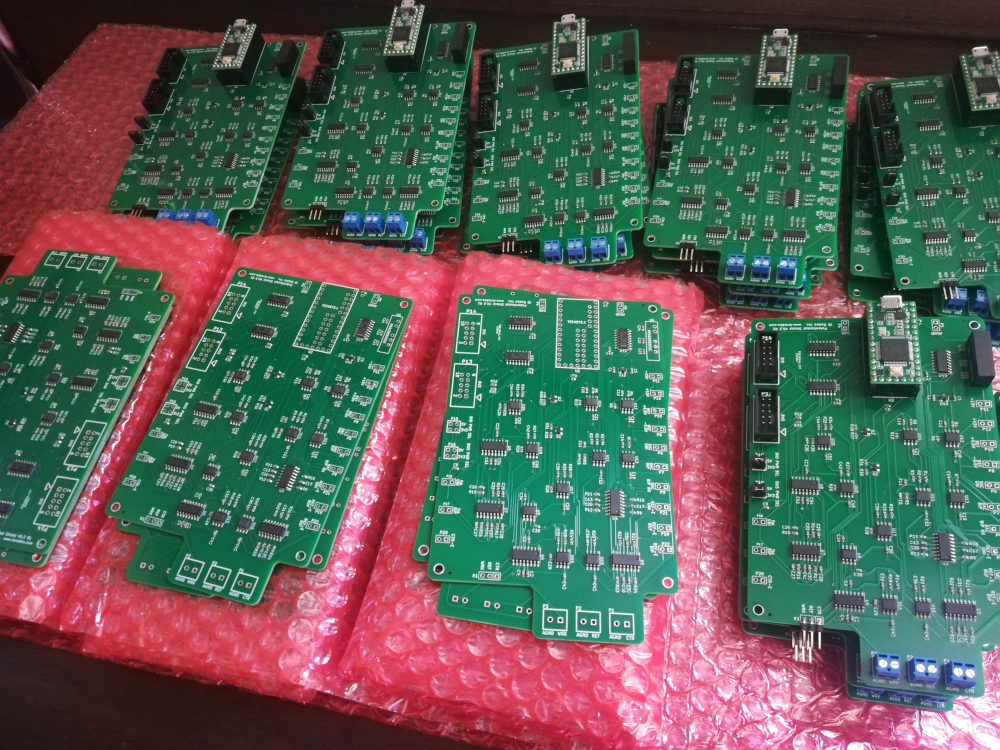
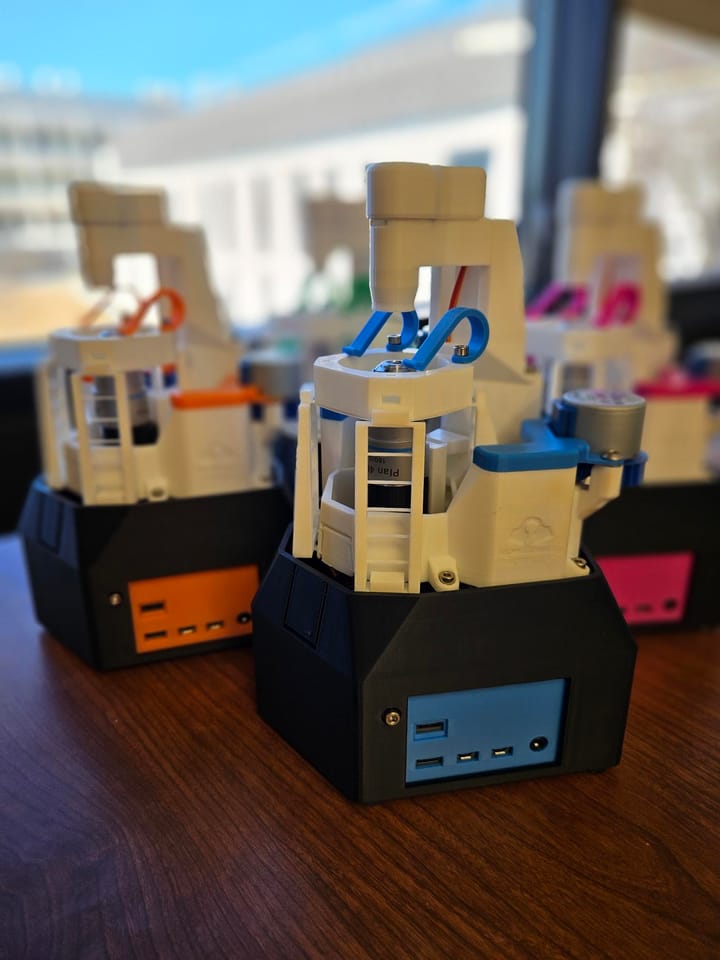
Like many electronics manufacturers, we have been dealing with supply-chain issues this year, as many electronics components have become difficult to source. This has particularly impacted one of our most popular products, the Rodeostat open source potentiostat which uses a couple of components we have had trouble stocking. In June we had sourced enough components to make a limited run of 60 Rodeostat PCBs. We have been busy assembling and testing the finished boards and over the last week we have started shipping orders to people that filled out the Rodeostat Stock Notification Form.
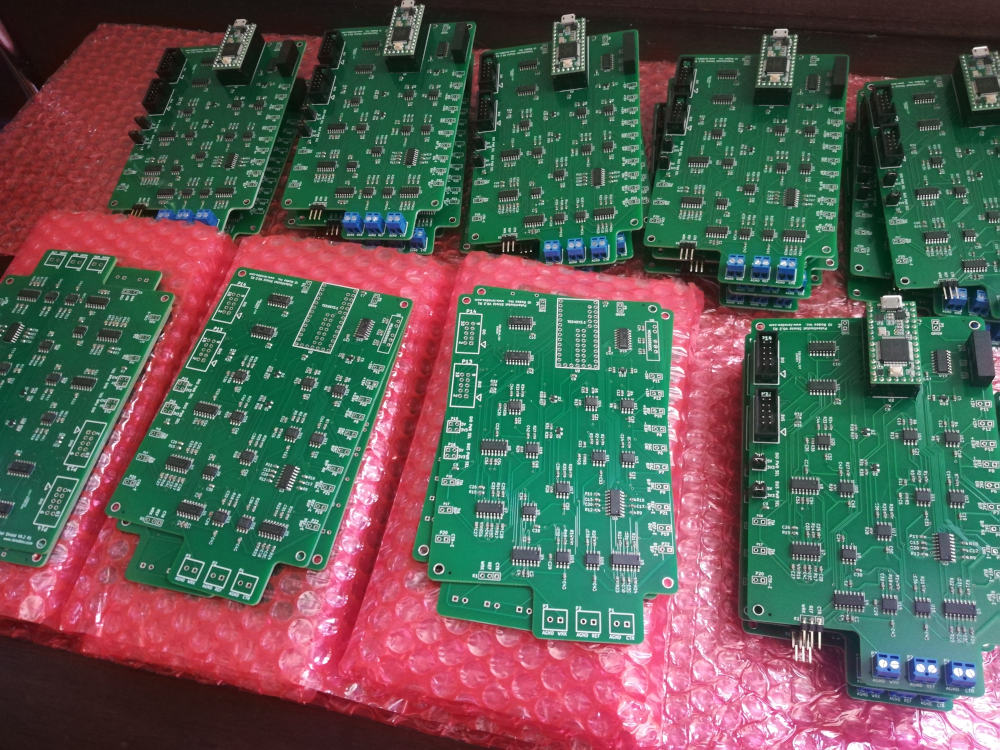
The Rodeostat is also back in stock on our website now! Click on the link below to visit the product page!
Environmental Gas Sensor Project Update
We started collecting data this week for the open source environmental gas sensor project. We set out to compare data from two units initially. The device reading from Sensor 1 was powered by a 2000mAh (milliamp hour) battery and Sensor 2 was powered by a 6600 mAh.
The two sensors were co-located outdoors on a outdoor patio table with date collection starting at approx. 10AM on July 21st. They were both moved indoors from around 10PM to approx. 9:30AM the following morning, July 22nd when they were placed back outdoors in the same location. At approx 1:30PM the battery in Sensor 1 required recharging and the device stopped collecting data. This gave us roughly 27.5 hrs of data.
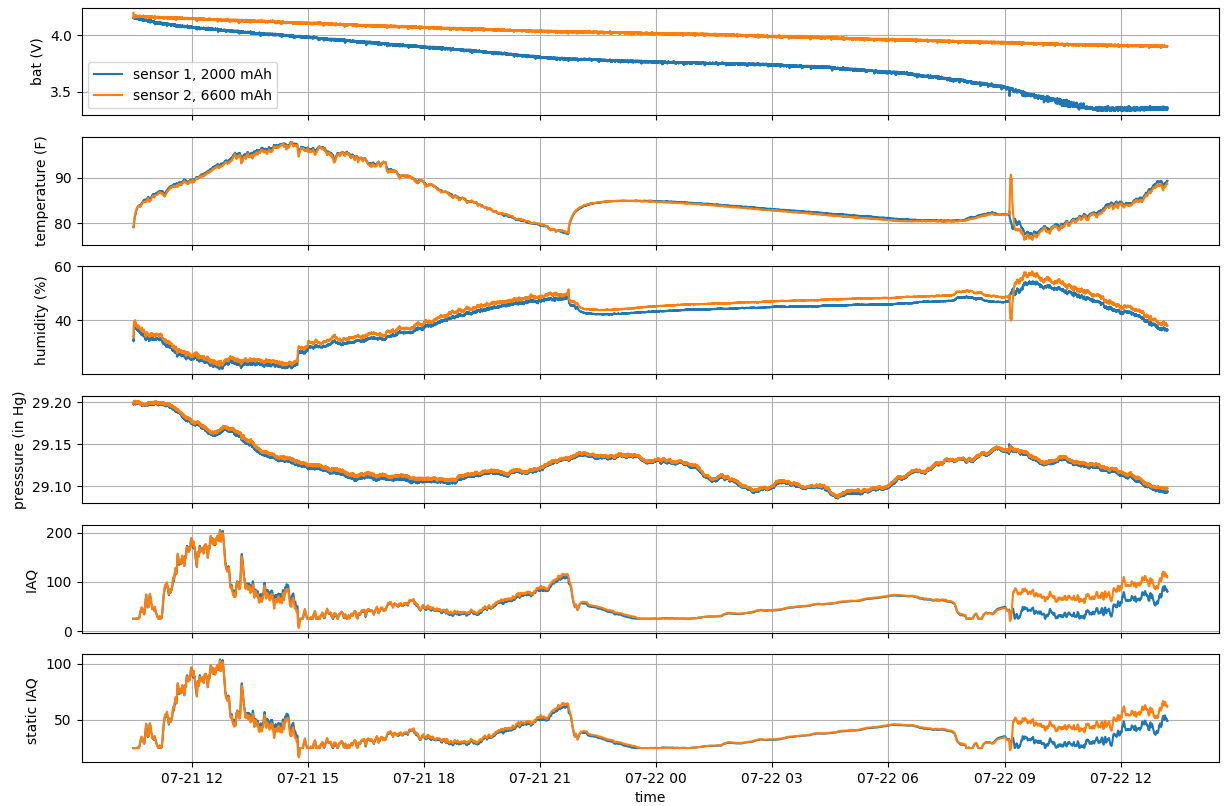
From the graphs above you can see that the data collected from the two devices were very similar, and were overlaying each other for most of the time period, especially the temperature, humidity and pressure readings. The only difference we can see is for IAQ and SIAQ on the second time outdoors period. This also coincided with when the battery for Sensor 1 was losing charge which may have affected performance. We will need to do some tests to confirm this.
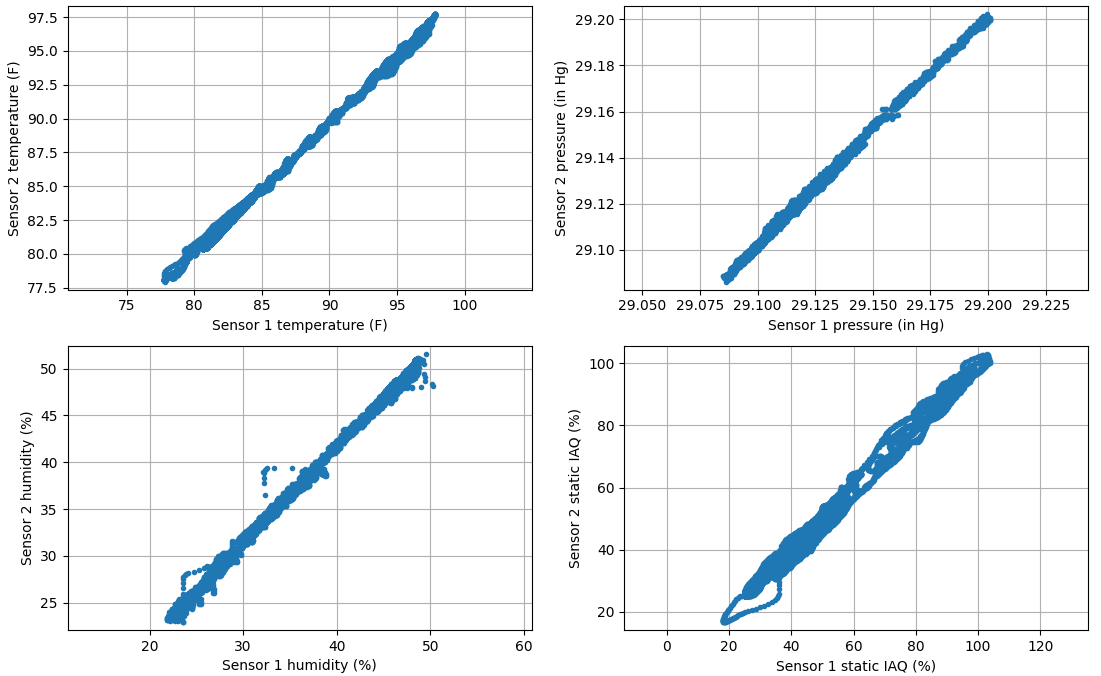
To better compare the data we plotted the readings as scatterplots comparing Sensor 1 vs. Sensor 2. As you can see from the scatterplots below, the data for the two sensors was very similar for temperature, pressure and humidity, with some more variability seen for SIAQ (static IAQ), though they were still performing very comparably.
IAQ and SIAQ are defined in the BME688 documentation as follows:
IAQ: Index for Air Quality, especially recommended for mobile devices, since the auto-trim algorithm automatically adopts to different environments
SIAQ (s-IAQ): “Static” Index for Air Quality, especially recommended for stationary devices (w/ o auto-trimming algorithm)
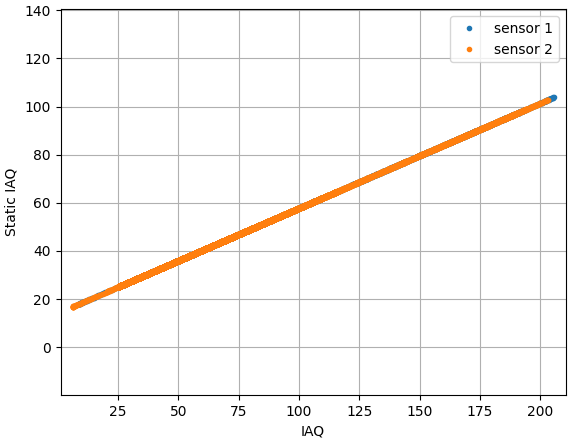
The auto-trim algorithm mentioned above is used in the proprietary BSEC Software (Bosch Sensortech Environmental Cluster) but the actual auto-trimming algorithm is not explained any further in the documentation that we could find. However, when you compare IAQ and SIAQ values from the two devices as shown below, there is a very clear linear relationship (slope=0.44, offset=14) between IAQ to SIAQ in the BSEC during this time period. So perhaps either reading would most likely work well, however we need more testing to confirm this.
Bookmarks



Comments ()