Characterizing LEDs and sample absorbance spectra with a USB spectrometer
Characterizing LEDs and sample absorbance spectra with a USB spectrometer
In this newsletter we describe an open hardware design and an open source software program for collecting data using a commercial USB spectrometer. This instrument was used to (1) characterize the LEDs we are using in our Open Colorimeter and (2) characterize the absorbance spectrums of several different colored solutions (food dyes) which we are planning to use in a series of tests of our new colorimeter design.
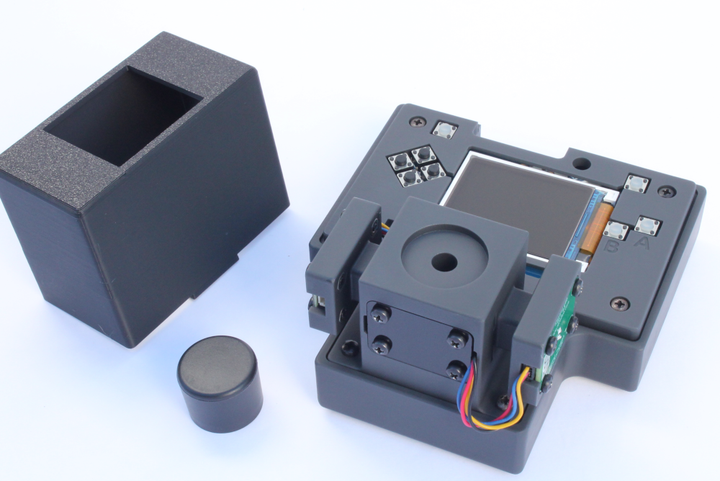
Hardware: custom cuvette holder
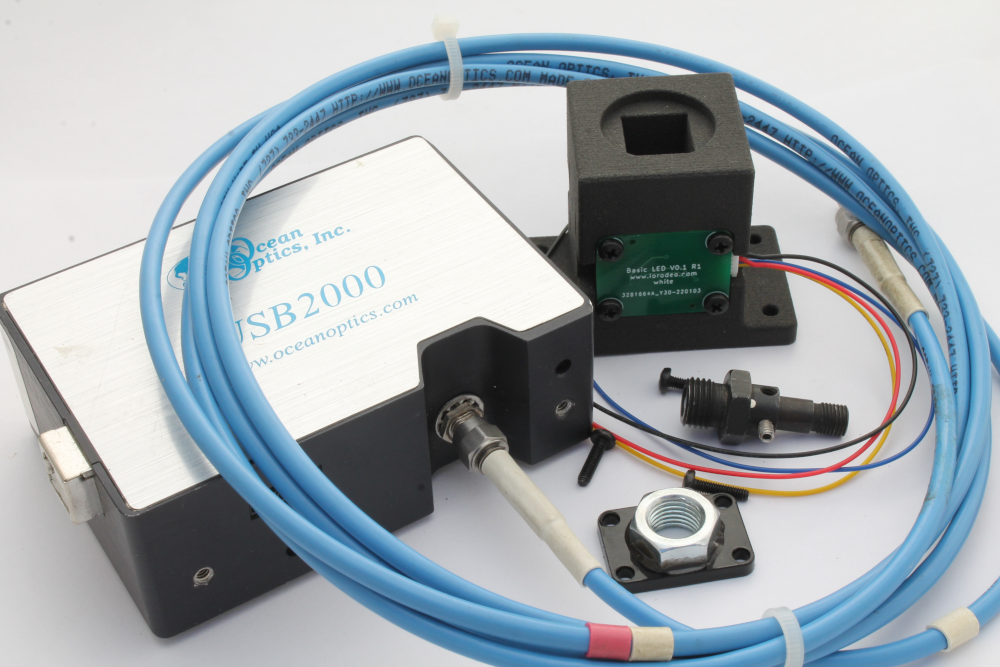
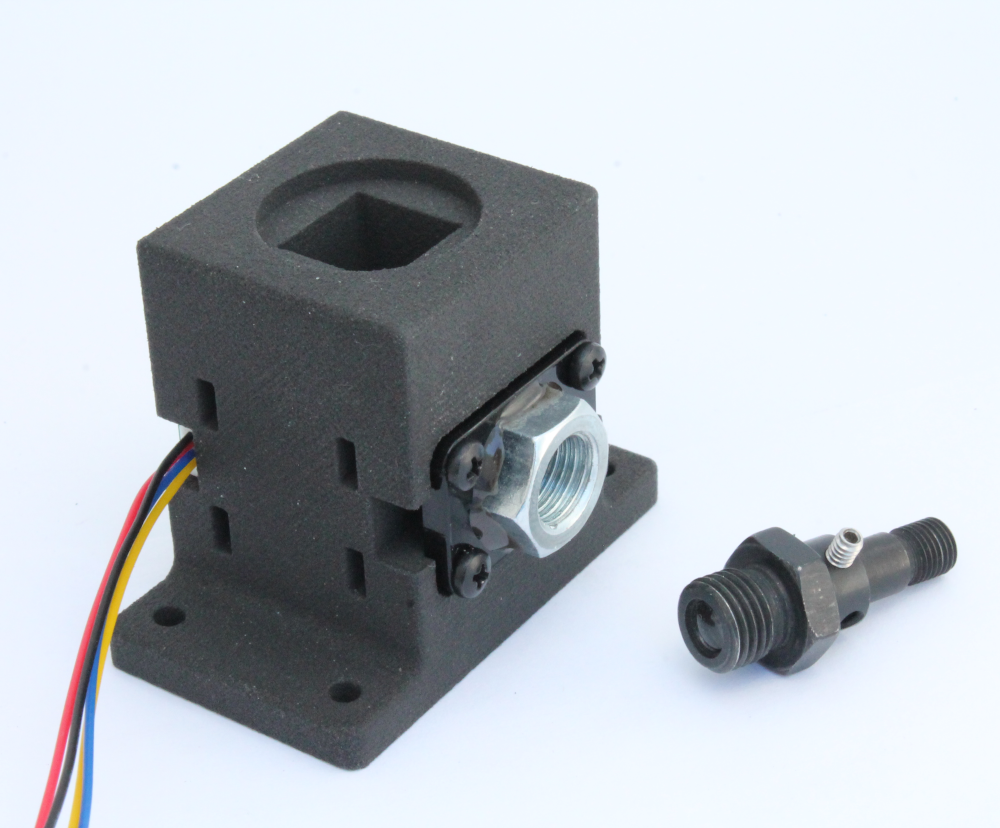
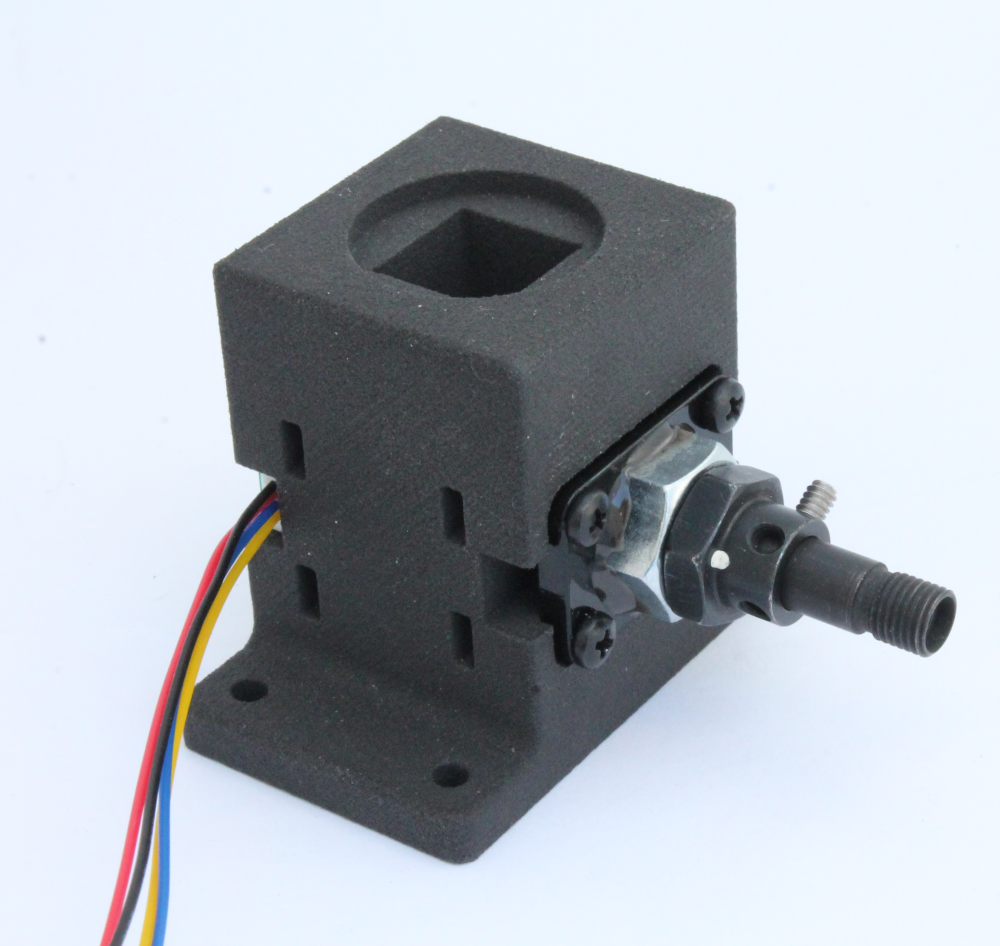
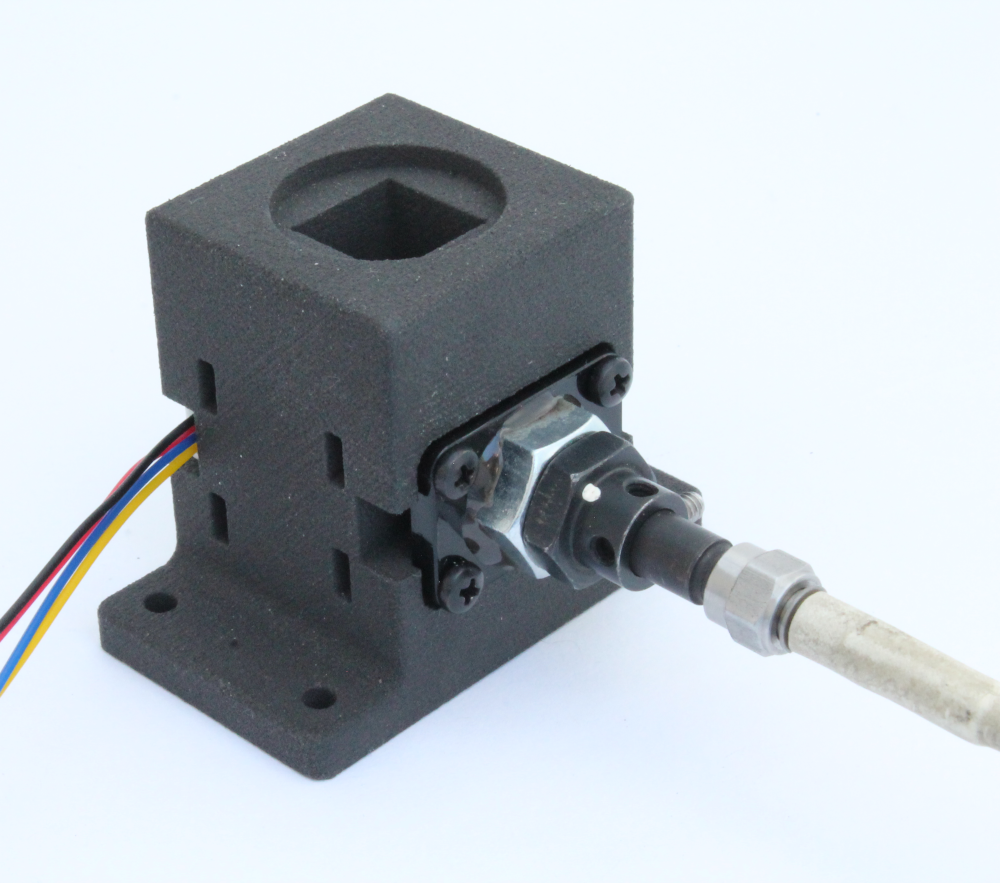
We customized one of the Open Colorimeter cuvette holders so that we could mount a collimating lens and fiber optic cable which then connects to a USB spectrometer. To do this we made a simple adapter which mounts to the cuvette holder and has threads for attaching the collimating lens.
Parts
- Ocean Optics USB2000. Note that this product is no longer available from Ocean Optics. However, Ocean Insight (formerly Ocean Optics) have some suggested alternatives
- Cuvette holder
- White light LED board
- Laser cut acrylic adapter - design files
- Ocean Optics collimating lens
- Adaper mounting hardware: 4 x M2.5, 10mm screws
- Collimating lens mounting hardware: 3/8-24 hex nut
Software: Python program
We developed a simple Python program sb_live_view to enable us to more easily work with the Ocean Optics spectrometer. This software displays a live view of the data from the spectrometer. The user can "blank" the instrument and capture the transmittance and absorbance values as a function of wavelength. We also added a peak finder tool and functions for saving data and plots. This software is open source and can found on github.
 iorodeo
The sb_live_view software is based on the python-seabreeze library and depends on numpy and matplotlib.
Experiment 1: Characterizing the Open Colorimeter LED spectrums
 IO Rodeo
The Open Colorimeter LED boards have been described previously in this blog post. Here we characterize the spectrum for each of the LEDs using the set-up and software described above.
Additional LED info from manufacturer spec sheets
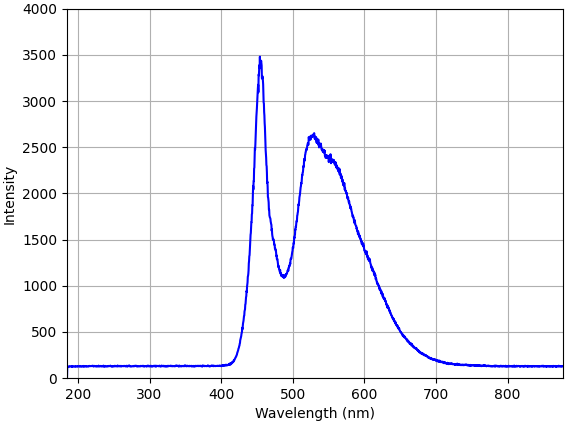
White LED
- Luminous intensity: 850 mcd (typ.)
- Viewing angle: 130°
- Mfr Part #: NCD0603W3
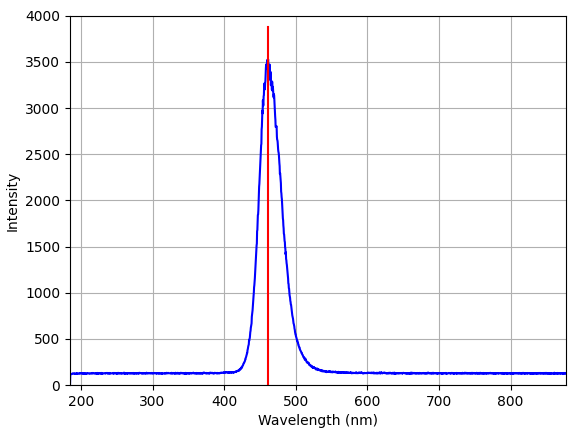
Blue LED
- Peak wavelength: 468 nm
- Dominant wavelength: 465-475 nm
- Bandwidth: 25 nm
- Luminous intensity: 28.5 mcd
- Viewing angle: 120°
- Mfr Part #: 19-217/BHC-ZL1M2RY/3T
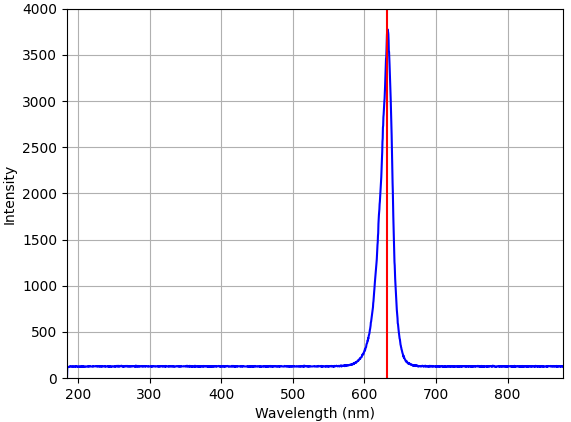
Red LED
- Peak wavelength: 630 nm
- Dominant wavelength: 618-628 nm??
- Bandwidth: 20 nm
- Luminous intensity: 100 mcd
- Viewing angle: 120°
- Mfr Part #: E6C0603URAC1UDA
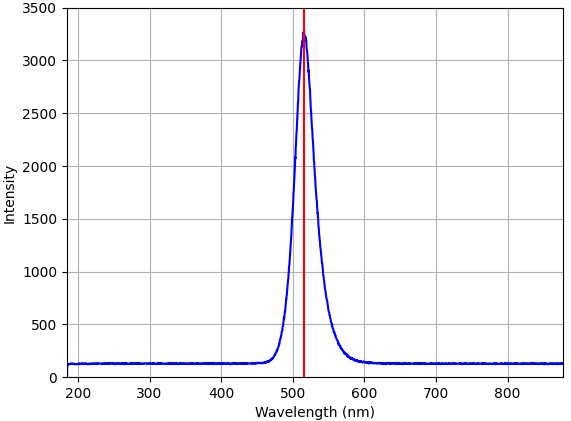
Green LED
- Peak wavelength: 516-525 nm (typ. not reported)
- Dominant wavelength: 513-528 nm
- Bandwidth: 15 nm
- Luminous intensity: 210-430 mcd
- Viewing angle: 120°
- Mfr Part #: SZYY0603G
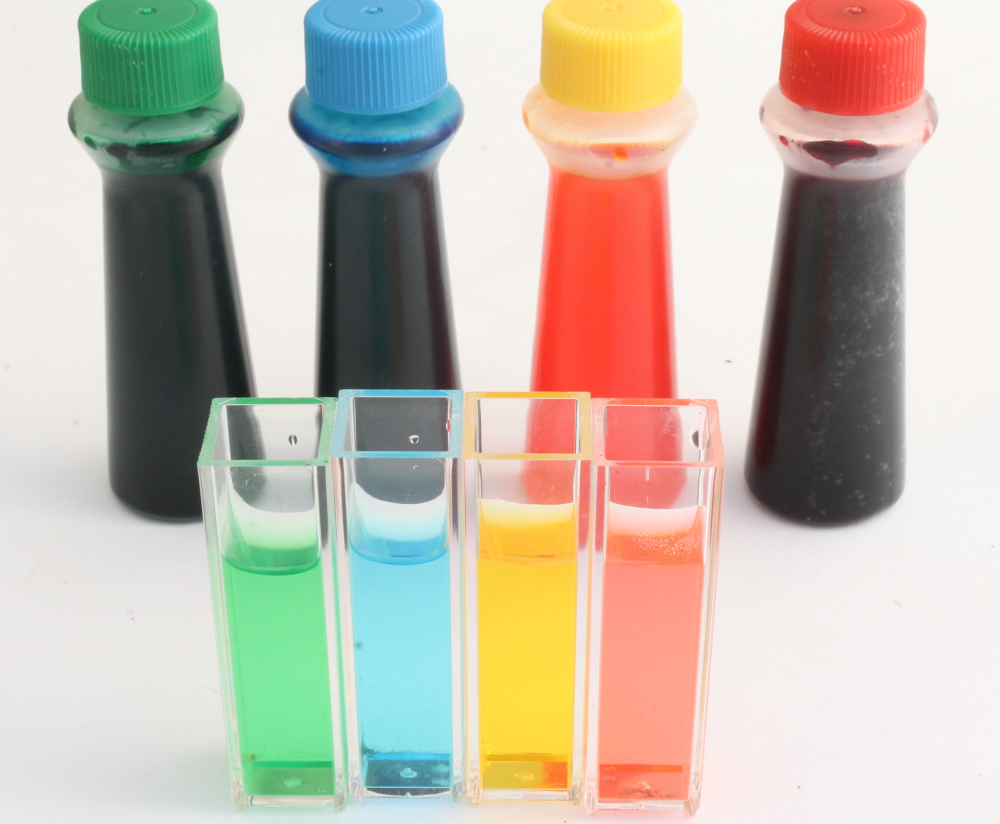
Experiment 2: Absorbance spectrum of different colored food dyes
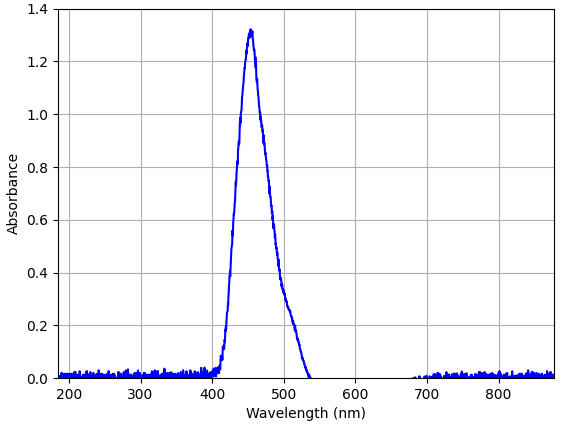
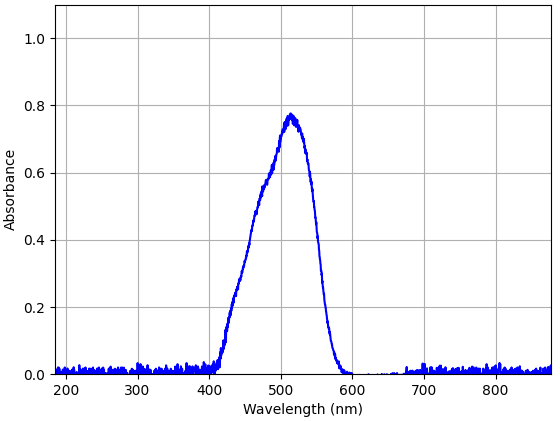
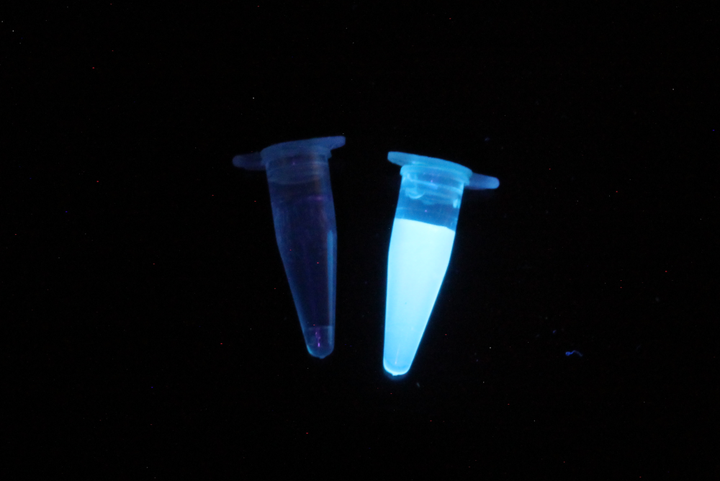
Using the same experimental set-up we characterized the absorbance spectrum of different test solutions using a white LED light source (approx. 400-700 nm). The goal was to determine the peak absorbance wavelength for each dye. We plan to use these dyes to test our new Open Colorimeter design. Food dyes are readily available from most grocery stores and are a great way to run introductory labs like Beer's Law or determining molar extinction coefficients.
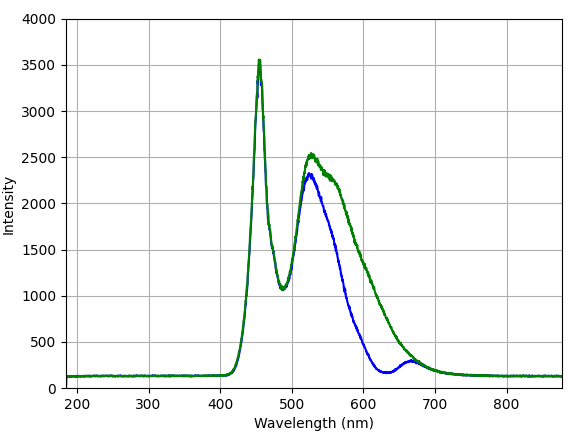
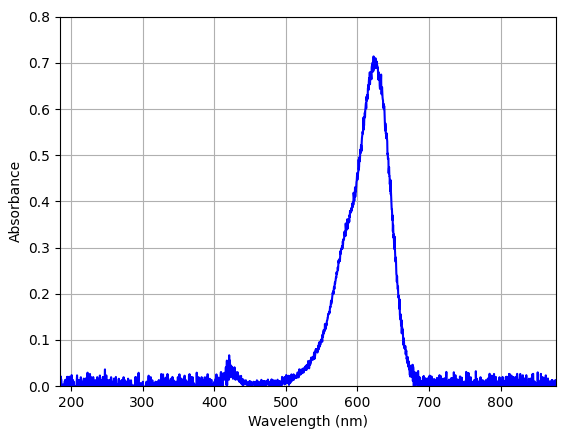
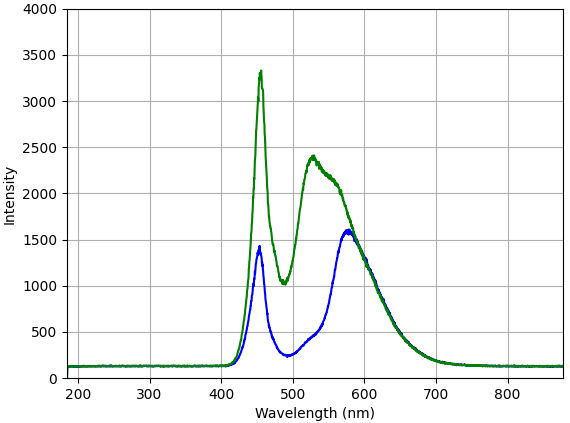
For each dye we prepared a diluted sample in a cuvette and determined the spectral profile of the white light LED with a blank cuvette with water (left panel, green line) or with the food dye (left panel, blue line). Next we calculated the absorbance and used the peak finder tool to determine the absorbance max. for each food dye (right panel, blue line).

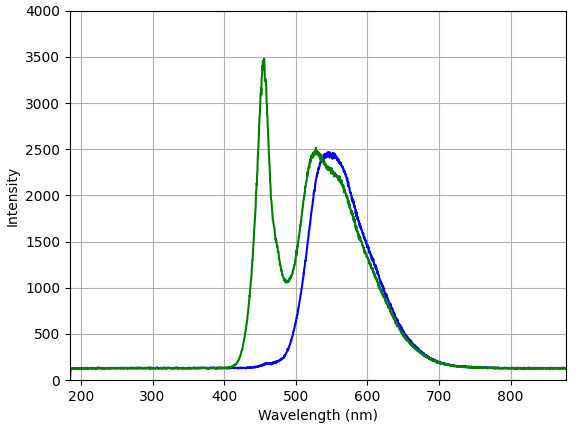
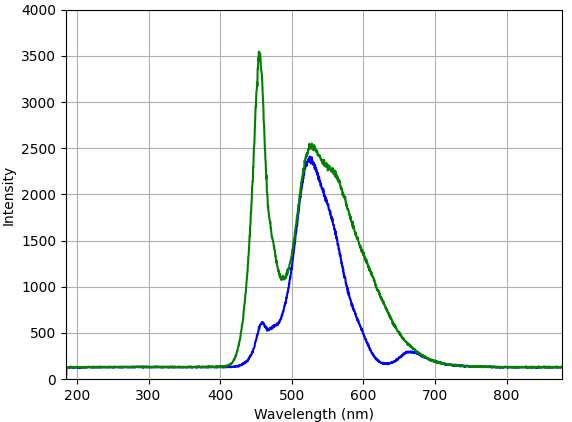
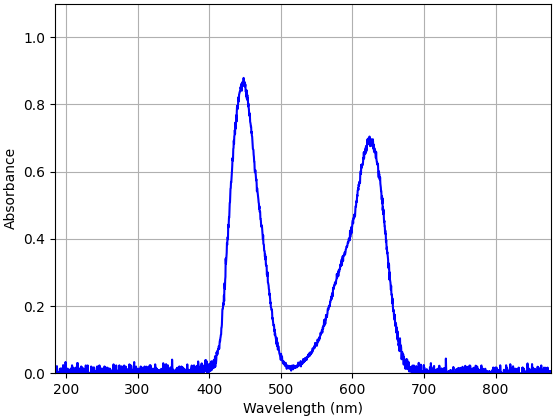
As the green food dye is actually a mix of blue & yellow dyes, we can detect the two corresponding blue and yellow absorbance peaks!
Comments ()