Creating custom calibrations using oc-calibration-app
In this set of notes we describe how to generate custom calibrations for the Open Colorimeter using a simple web app called the oc-calibration-app. This app makes fitting your calibration data and generating the required .json file for your colorimeter quick and easy. The app is developed using the Streamlit framework and it can be accessed and run from the Streamlit Community Cloud or installed locally on your own computer.
Using the web app
Use the link below to open the web app in your browser.
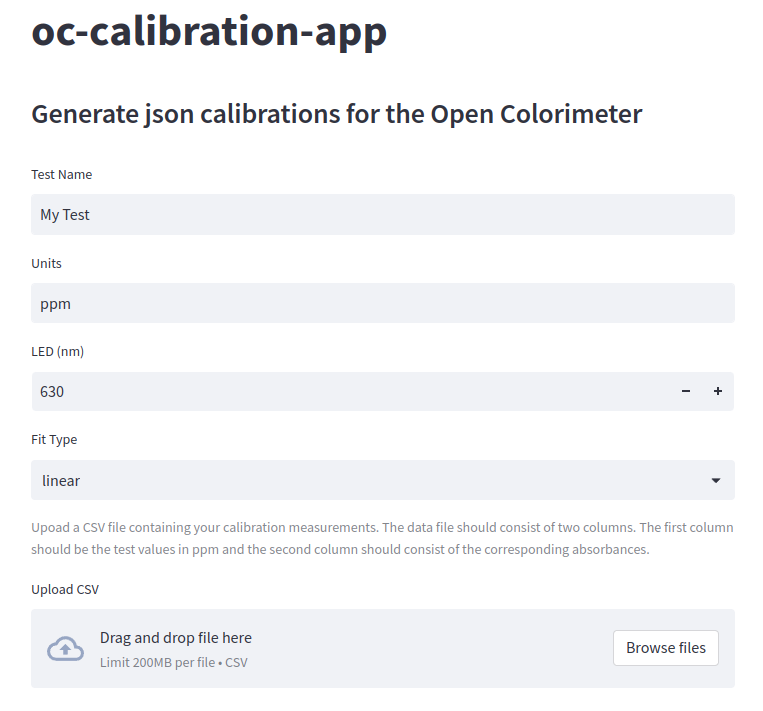
Using the fields on the app you can then enter the following information regarding your custom calibration.
- Test Name: a string specifying the name of the test.
- Test Units: a string specifying the units for measurement, e.g. ppm or mg/L.
- LED (nm): an integer specifying the led wavelength used in nm
- Fit Type: the fit type for the calibration, either "linear" or "polynomial"
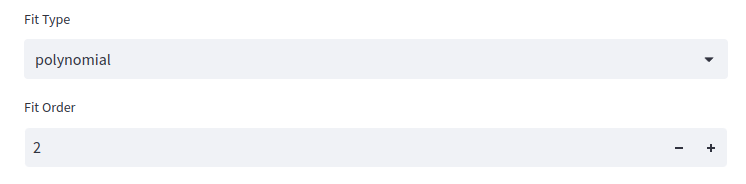
If the Fit Type = polynomial is selected an additional field, Fit Order, will appear asking you to specify the order of the polynomial you wish to use for the fit as shown below.
The next step is to upload a CSV (Comma-Separated Values) file containing your data. A CSV file can be easily generated using a spreadsheet application or a text editor. This should be a plain text file with two columns of data separated by commas as shown below.
0,0
10,0.28
20,0.58
30,0.86
40,1.2
50,1.47
Example CSV file format
The first column of data should consist of the test samples. These should be given in your Test Units, e.g. ppm or mg/L. In the example file above these are the numbers 0, 10, 20, ... , 50.
The second column of data should consist of the absorbance measurements corresponding to the test samples. In the example file above these would correspond with the numbers 0, 0.28, 0.58, ... , 1.47.
Thus each row of the CSV file consists of a pair of numbers separated by a comma. The first number is the test sample and the second number is the corresponding absorbance measurement.
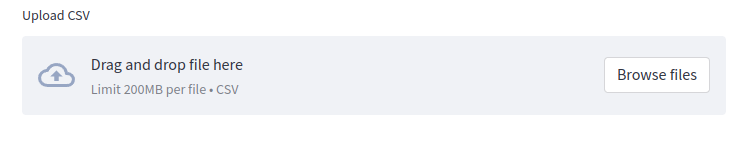
To upload your data into the app you can simply drag and drop the file to the file uploader widget on the app or use the Browse Files button on the widget to open a file selection dialog. An image of the file uploader widget is shown below.
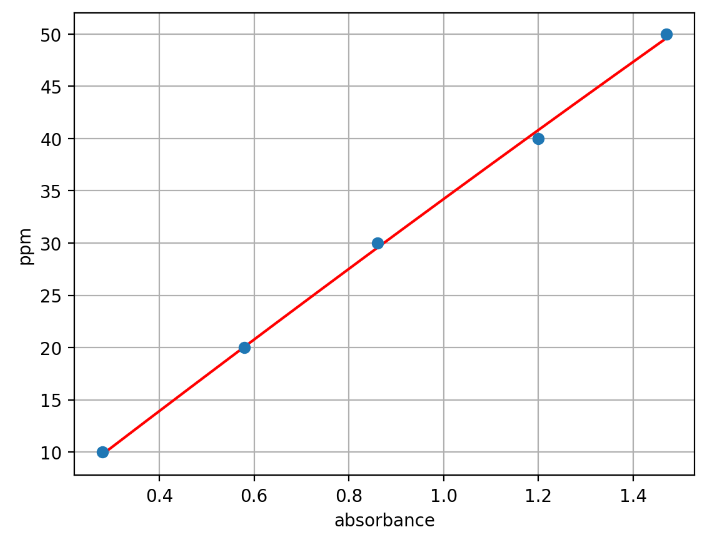
Once your data is uploaded, a plot of your data (blue dots) and the resulting fit (red line), will be displayed
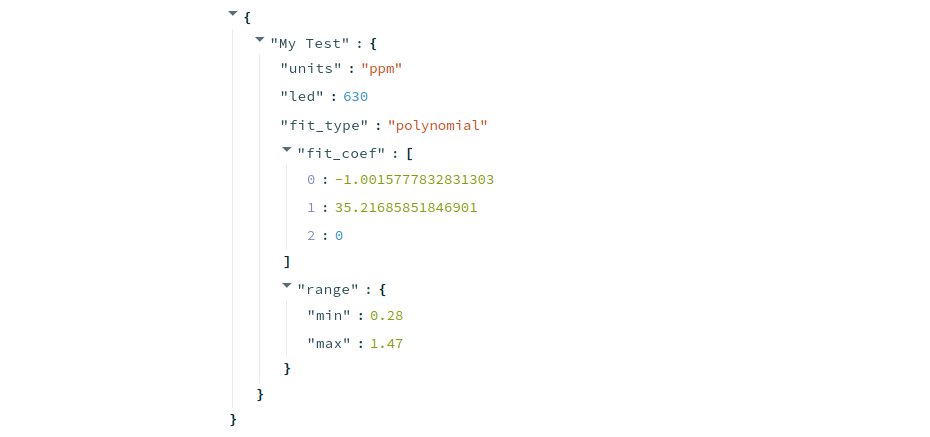
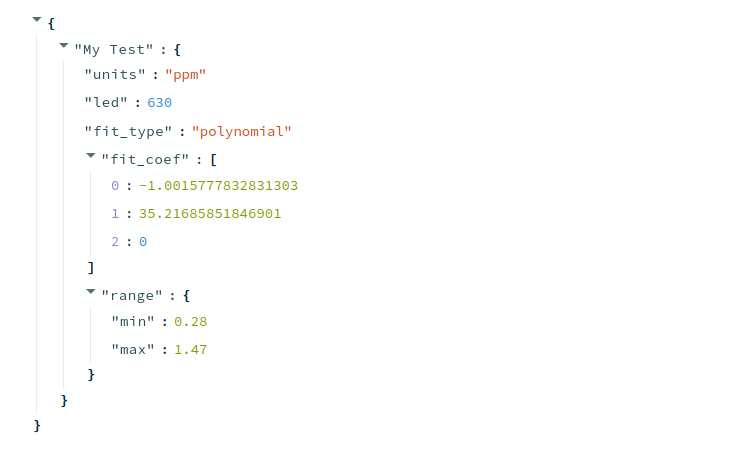
In addition the .json "calibration object" for your colorimeter will be shown below the plot on the app window. It will look similar to the example below.
At any time you can go back and change any of the values entered earlier such as the Test Name, Fit Type, Fit Order, etc.
Once the fit looks satisfactory you can either download the .json data to your computer using the Download json calibration data button shown below

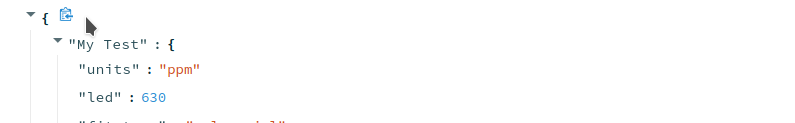
An alternative option is to copy the data to your computer's clip board by clicking on the clip board icon which appears next to the json data when you hover your mouse pointer is near the json display as shown below.
Source code repository
The source code for the Streamlit app can be found on Github
 iorodeo-streamlit
Running the app locally
The oc-calibration-app can also be run locally. The dependencies can be installed using the Poetry package manager. The app can then be run using the streamlit command line app as follows:
streamlit run app.pywhere app.py can be found the oc-calibration-app/oc_calibration_app sub-directory of the project.

Open Colorimeter Product Guide
Documentation site for the Open Colorimeter, Multi-Channel Colorimeter, UV Open Colorimeter & Open Colorimeter Plus
Product Guide Home Page