Rodeostat Web App Software
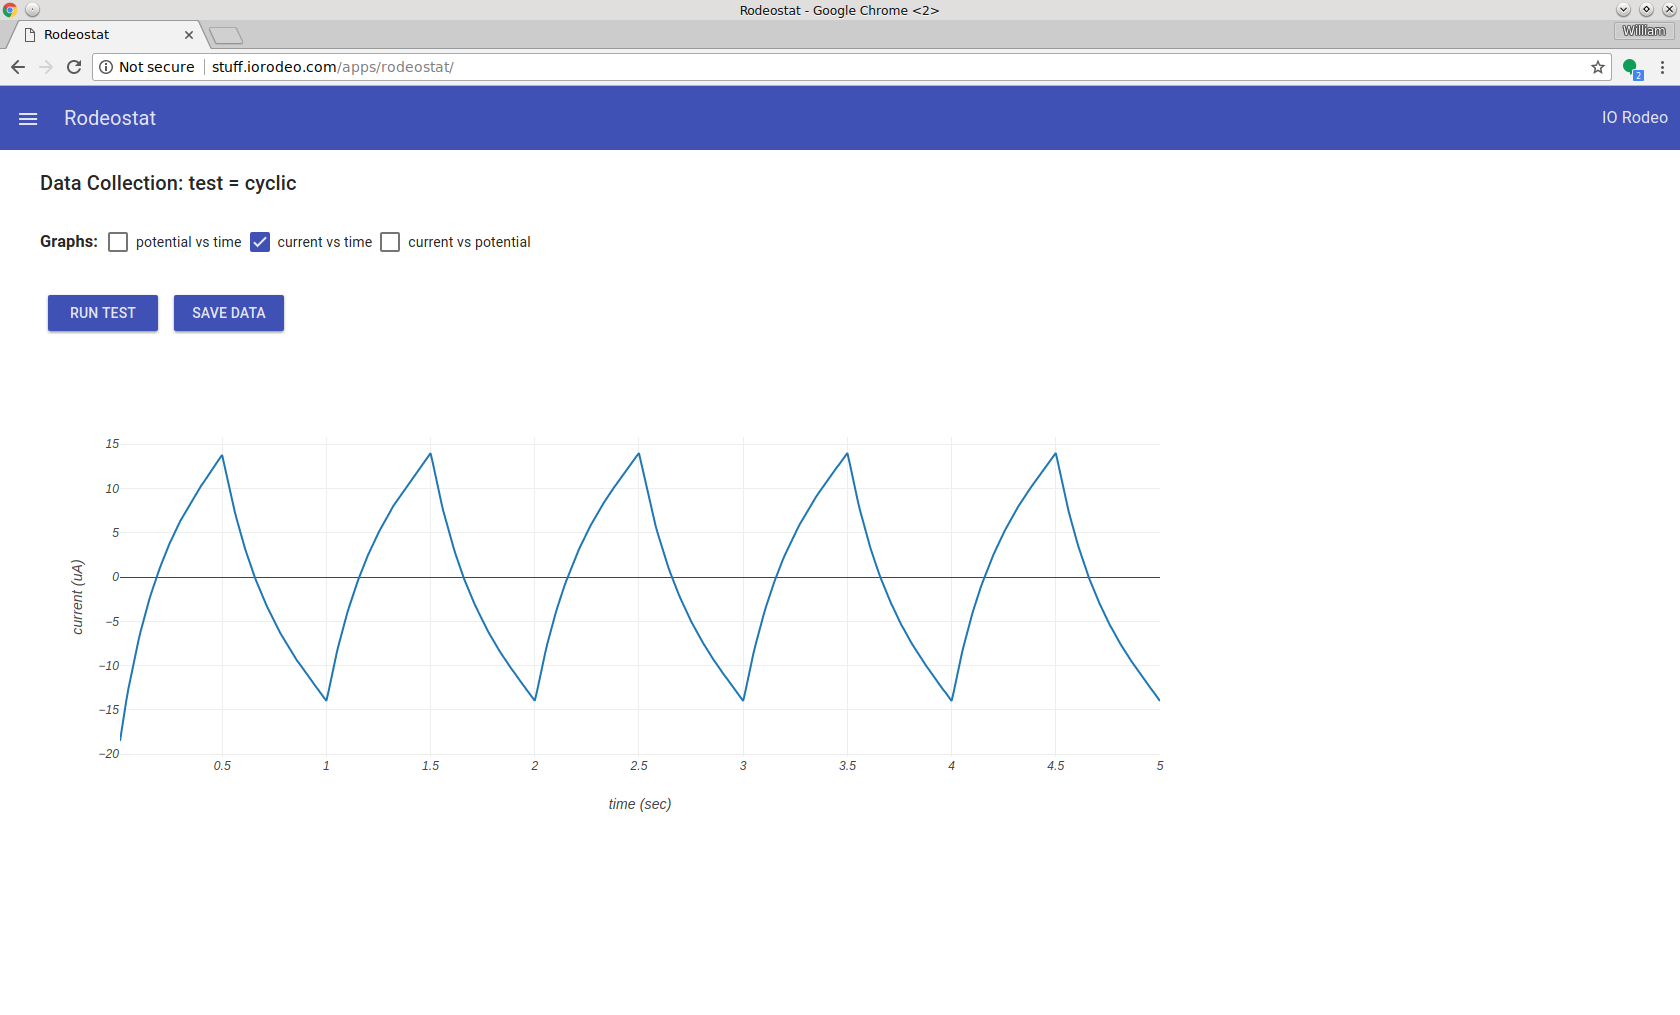
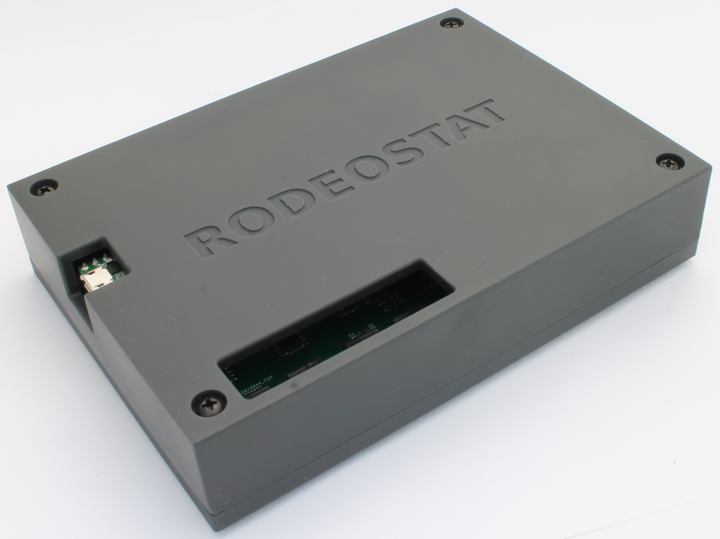
Software for IO Rodeo's open source potentionstat is now available. The software provides a user friendly graphical interface. The software, written in javascript, runs in a web browser and allows the user to configure test parameters, visualize test results and save data.
Requirements
- Serialport-bridge: Before using the Rodeostat software it is necessary that you have IO Rodeo's Serialport-bridge software installed and running on your computer. The Serialport-bridge software enables javascript applications running in your web browser to access and control devices connected to your computers USB/Serial ports. Instructions for downloading and installing the Serialport-bridge software can found here.
- Web Browser: A reasonably recent version of either Google Chrome or Firefox.
Getting the Software
The Rodeostat web app software requires no installation and can be accessed using your web browser by going to this link https://iorodeo.github.io/rodeostat-webapp-build/.
Note, there is a new flag in chrome browser which can prevent the serialport-bridge from communicating with the web app software. You can change the value of this flag here (chrome://flags/#block-insecure-private-network-requests). On the page change "Block insecure private network requests" from "Enabled" to "Disabled". This will allow the web app software to communicate with the serialport-bridge. Note, you will need to restart chrome after making this change in order for the change to take effect.
Menus and pages
Once the software is running you should see a page in your web browser which looks like the image below.
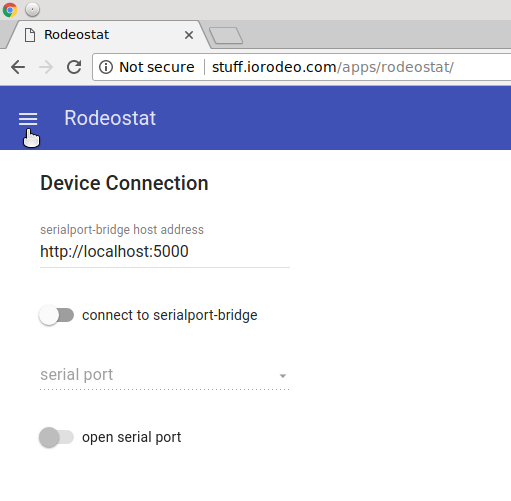
Notice the "triple bar" menu in the upper left corner of the page. This is the navigation menu. Clicking on this menu will allow to move between the various pages of the application. There are currently three pages in the Rodeostat application as shown in the image below.
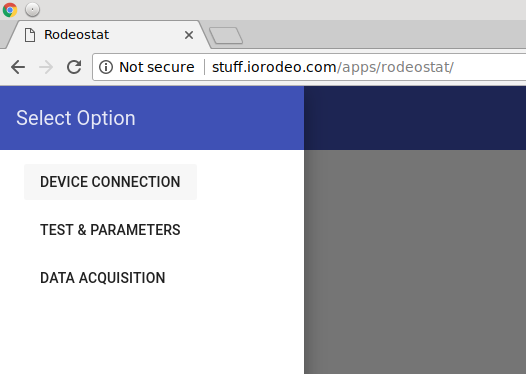
The three pages provide the following functionality:
- Device Connection: enables you to connect to the Serialport-bridge as well as to select and connect to the serial port associated with your Rodeostat.
- Test & Parameters: enables you to select a voltammetric test and to set the various test parameters to their desired values.
- Data Acquisition: enables you to run the currently selected voltammetric test and acquire data. Once the run is complete it will plot the resulting test data. It also enables you to either save the acquired data to file or to upload the data to Plotly.
Connecting to the Serialport-bridge
In order to control your Rodeostat and collect data using the web application software you will need to have the Serialport-bridge software on your computer installed and running. Before continuing make sure that you have this software running on your computer.
The "Device Connection" page of the Rodeostat web app should look as follows.
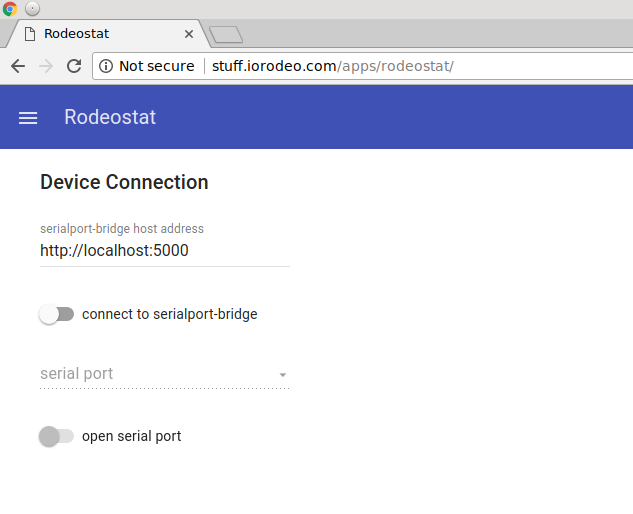
The Serialport-brige host address is the network address at which the Rodeostat web location expects to find the Serialport-bridge server. The default setting for this is "localhost:5000" which is network port 5000 on your computer. You won't need to change this setting if your Rodeostat, Serialport-bridge software and web browser running the Rodeostat web app are all running on the same computer.
The Connect to serialport-bridge switch is used to connect the Rodeostat web application to the Serialport-bridge. Once this switch is activated the software will connect to the Serialport-bridge and the serial port drop-down list will be populated with the USB/Serial devices available on your computer as shown below.
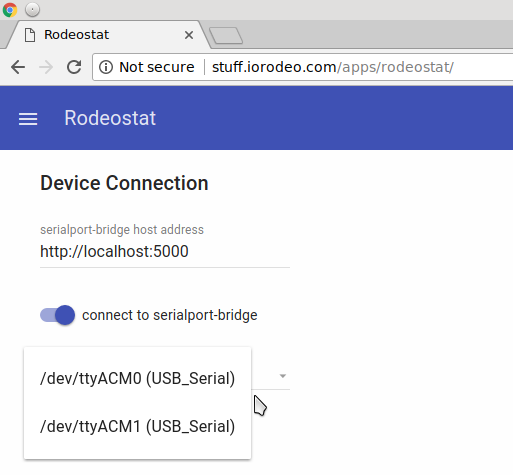
Next, select the USB/Serial port associated with your Rodeostat. Once you selected the USB/Serial port the menu should appear as shown below.
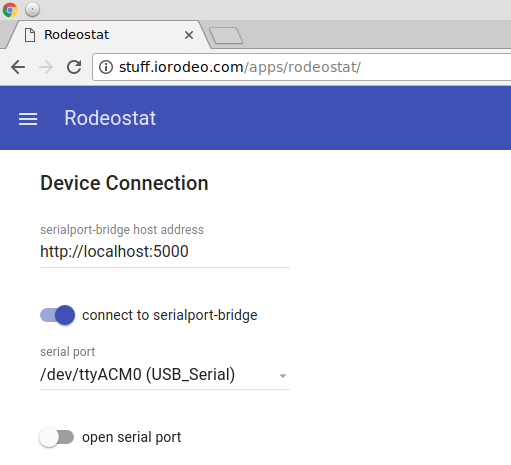
In the example above the USB/Serial port associated with the Rodeostat was /dev/ttyACM0. However, it may be different on your computer.
- On Windows the ports will be named COM1, COM2, etc.
- On Linux the ports will be named /dev/ttyACM0, /dev/ttyACM1, etc.
Note, if you don't know which USB/Serial port is associated with your Rodeostat the Serialport-bridge software can help figure this out. Simply go to the "Serial Ports" tab on Serialport-bridge and plug/unplug your Rodedostat. The new device which appears when you plug in your Rodeostat will be the one associated with it.
Connecting to the Rodeostat
Connect to the Rodeostat by activating the "open serial port" switch. Once you are connected to the Rodeostat the "Device Connection" tab will appear as shown below.
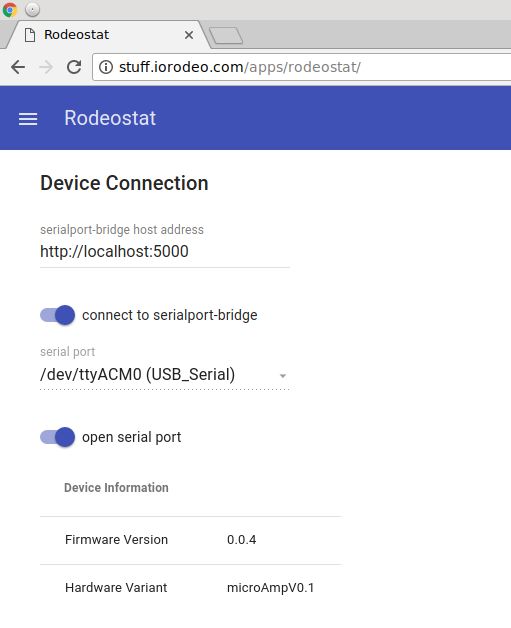
After the device is connected a table displaying information about the connected Rodeostat will appear. It will show the following:
- Firware Version - the version of the firmware running on the Rodeostat
- Hardware Variant - the hardware variant of the Rodeostat. This will normally be microAmpV0.1. However, if your Rodeostat is a customized hardware variant then this may read either nanoAmpV0.1 or milliAmpV0.1.
At this point you are finished with the "Device Connection" tab until you wish to disconnect from the Rodeostat and/or the Serialport-bridge software.
Selecting the Test and Setting Parameters
The next step is to use the "triple bar" menu to go the "Test and Parameters" page of the Rodeostat web app. On this page you can select the voltammetric test which you wish to run and set the parameters for this test. The "Test and Parameters" page will look as follows:
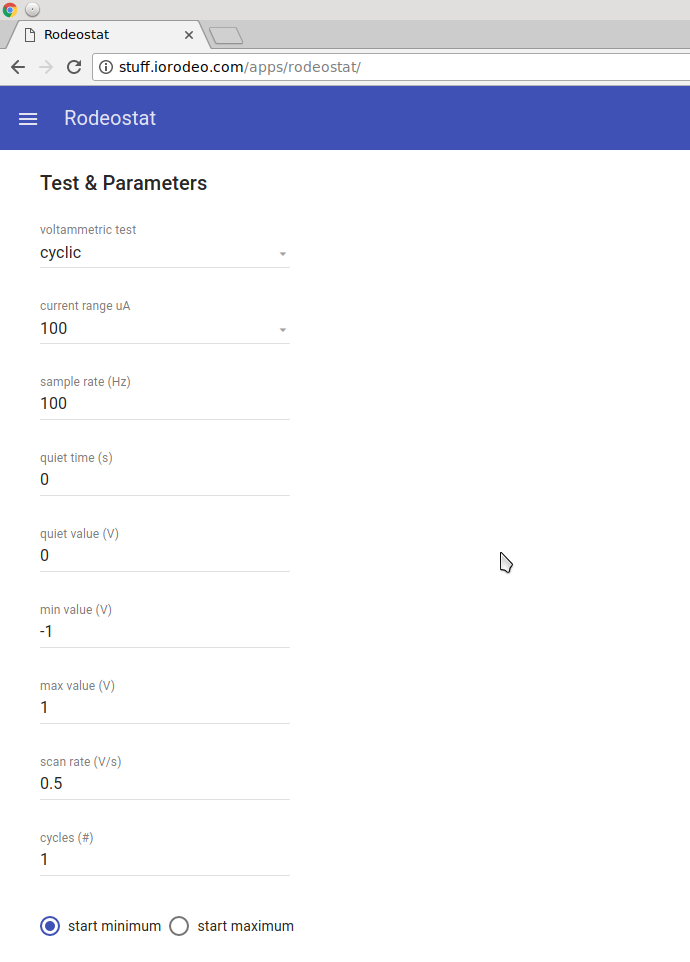
Note, in the above image the currently selected test is "cyclic". This may be different on your computer depending on the version of the software you are running.
The drop-down menu labeled voltammetric test can be used to select from the tests available on your Rodeostat. Note, the list of available tests may depend on the firmware version of your device.
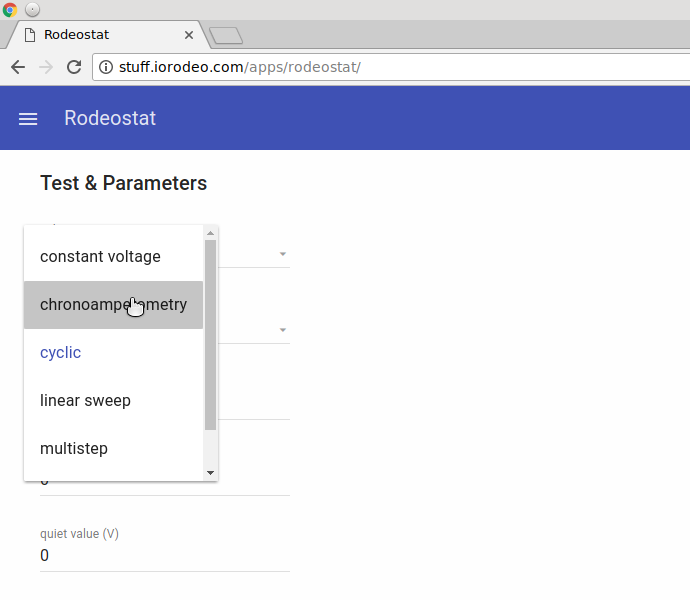
For each voltammetric test a different set of test parameters will be available. These parameters are specific to each test. Select the desired values for the parameters and then proceed to "Data Acquisition" page, using the "triple bar" menu, when you are ready to collect data.
Collecting Data
The "Data Acquisition" page is used when collecting data with your Rodeostat. Initially, before any data is collected, it will appear as shown below.
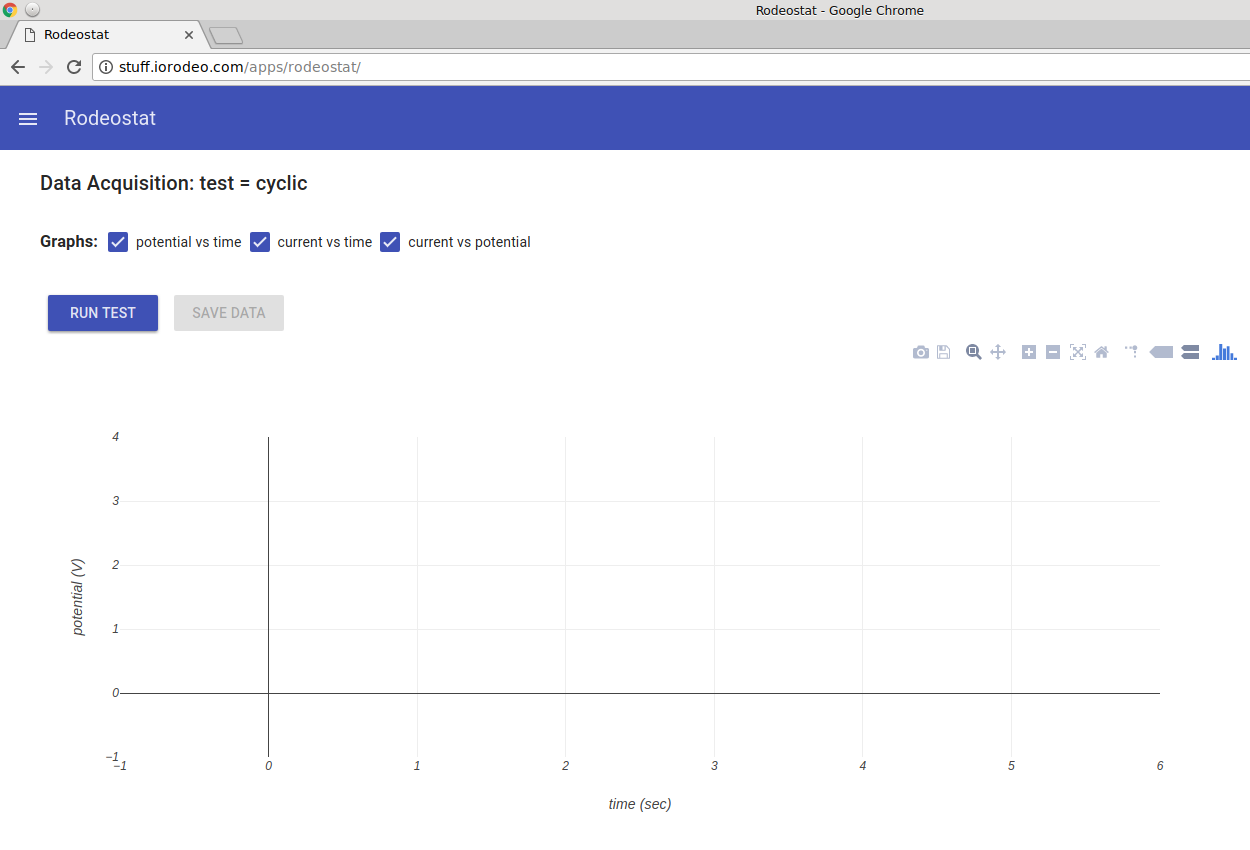
To run a test simply click the "Run Test" button. While the test is running a progress bar will be shown which displays the current progress of the test. When the test is complete the newly acquired data will be displayed in the graphs on the page.
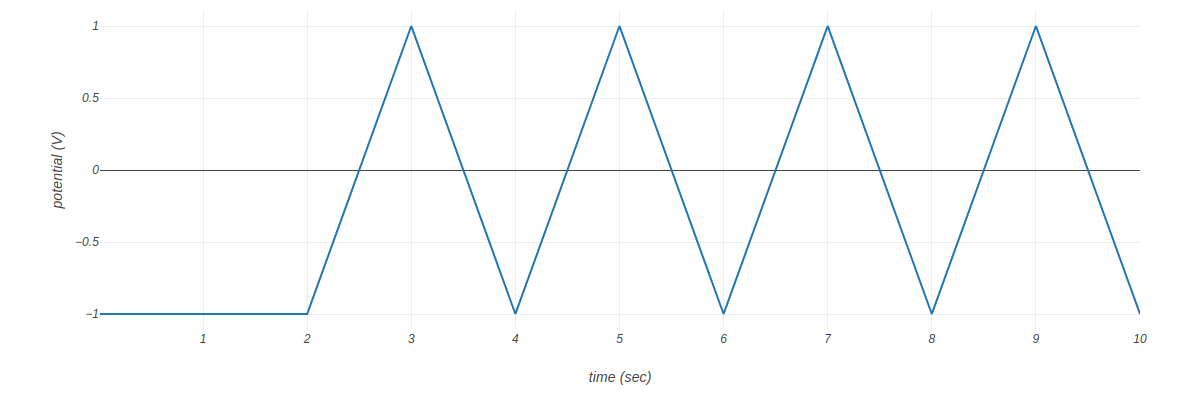
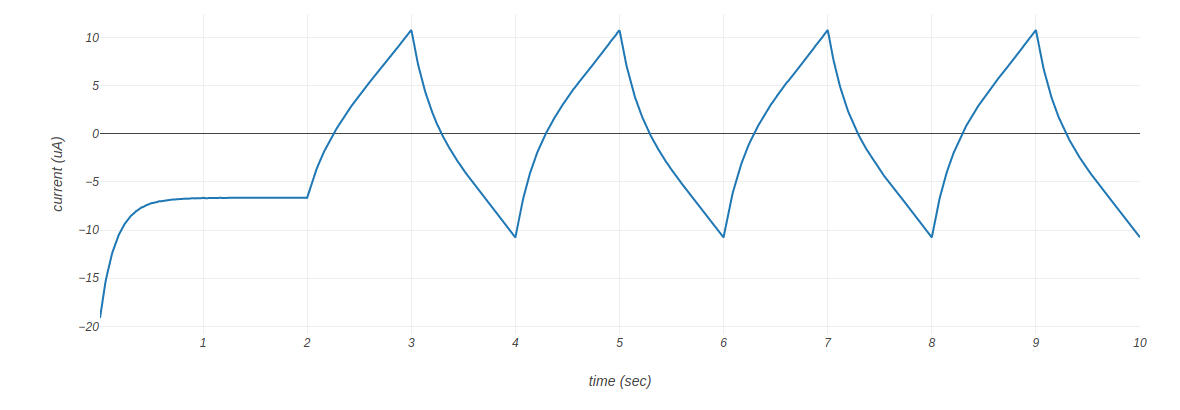
There are three possible graphs which can be displayed.
- Potential vs time
- Current vs time
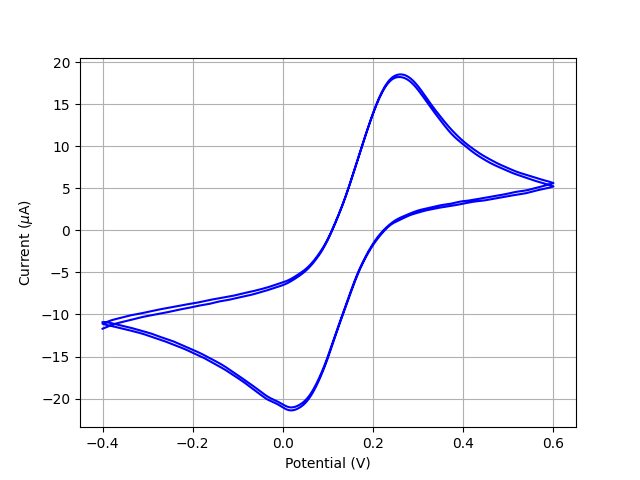
- Current vs potential
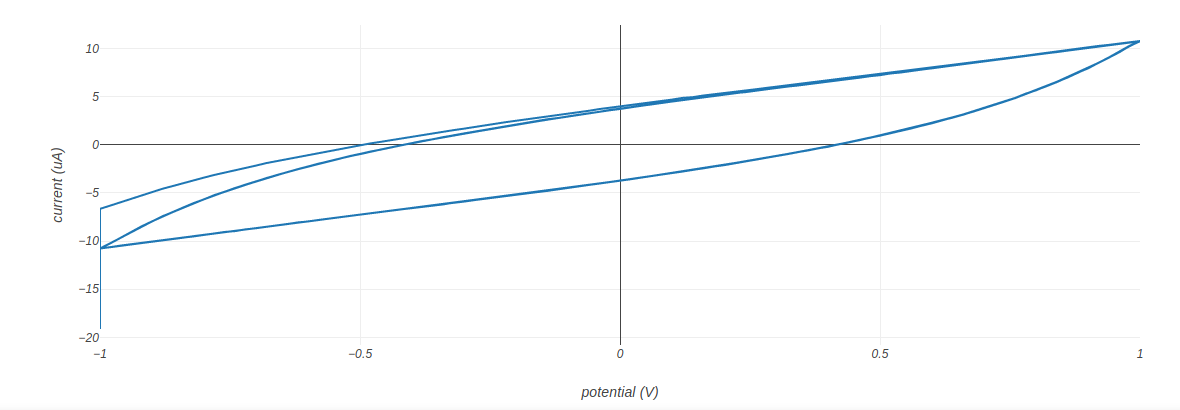
The graphs can be enabled/disabled using the checkboxes at the top of the page. Note, not all graphs will be available for every test. For example, only the "current vs time" graph will be available for the constant voltage test. Similary, only the "potential vs time" and "current vs time" graphs will be available for the Chronoamperometry test.
Each graph has an options toolbar with the actions shown below
-
Download the graph as a png

-
Save and edit plot in cloud (plotly)

-
Zoom

-
Pan

-
Zoom in

-
Zoom out

-
Autoscale

-
Reset axes

- Toggle spike lines

- Show closest data on hover

- Compare data on hover

Saving Data to File
The acquired data can be saved to a file on your computer using the "Save Data" Button.
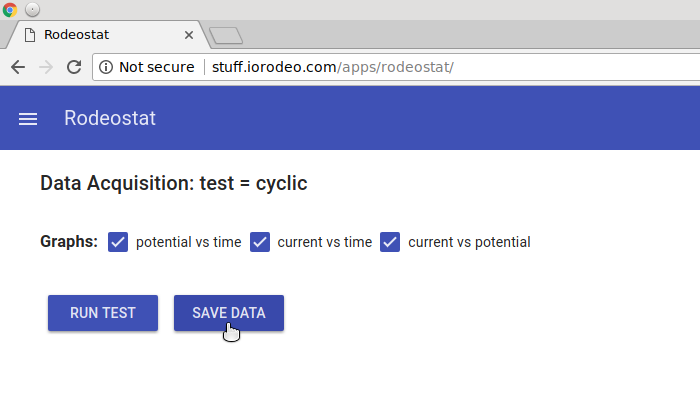
After clicking on the Save Data button a dialog will appear prompting you to enter a name for the data file and with "Cancel" and "Save" options.
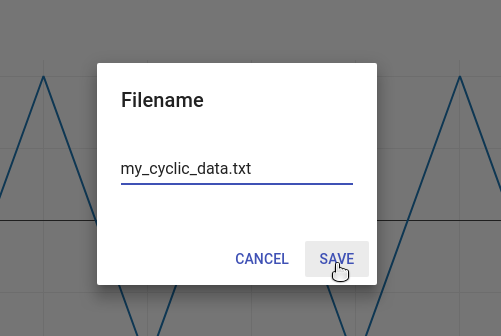
The data file will be saved to the download location as currently set for your web browser. This will typically be your "Downloads" folder, but it could be different.
- With Google's Chrome browser you can set the download location by going to chrome://settings/downloads.
- With Firefox you can set the download location by going to about:preferences.
Uploading Data to Plotly
Using the Save and edit plot in cloud button on the options toolbar for a graph you can upload the data in the graph to Ploty (https://plot.ly/). In order to do this you must have a plotly account and be currently logged into this account.

Comments ()