Measuring proteins with the Bradford assay
Methods for measuring protein concentration using the Open Colorimeter and 595nm LED.
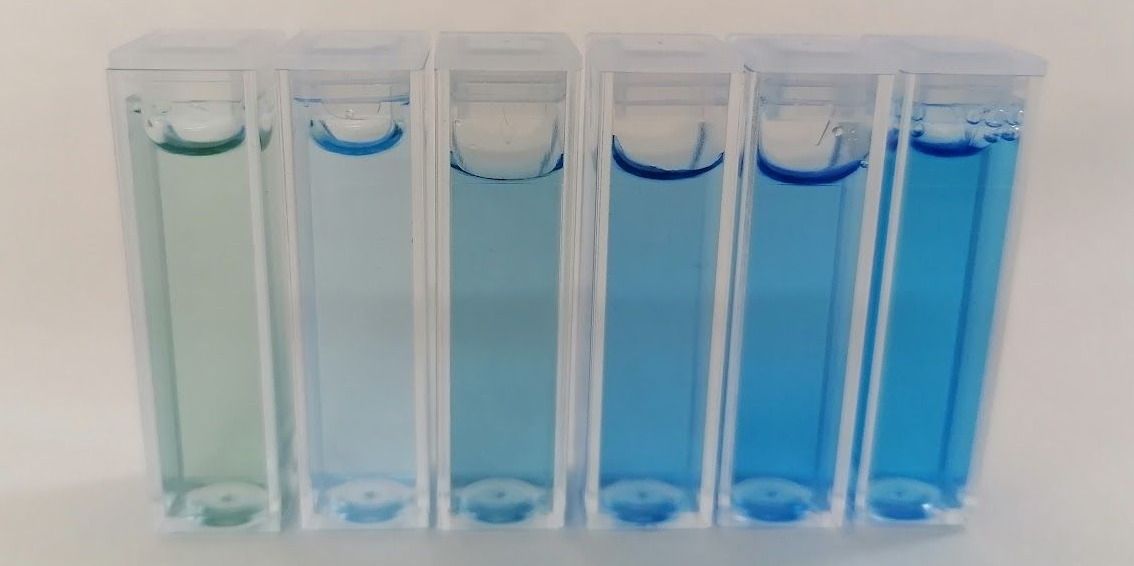
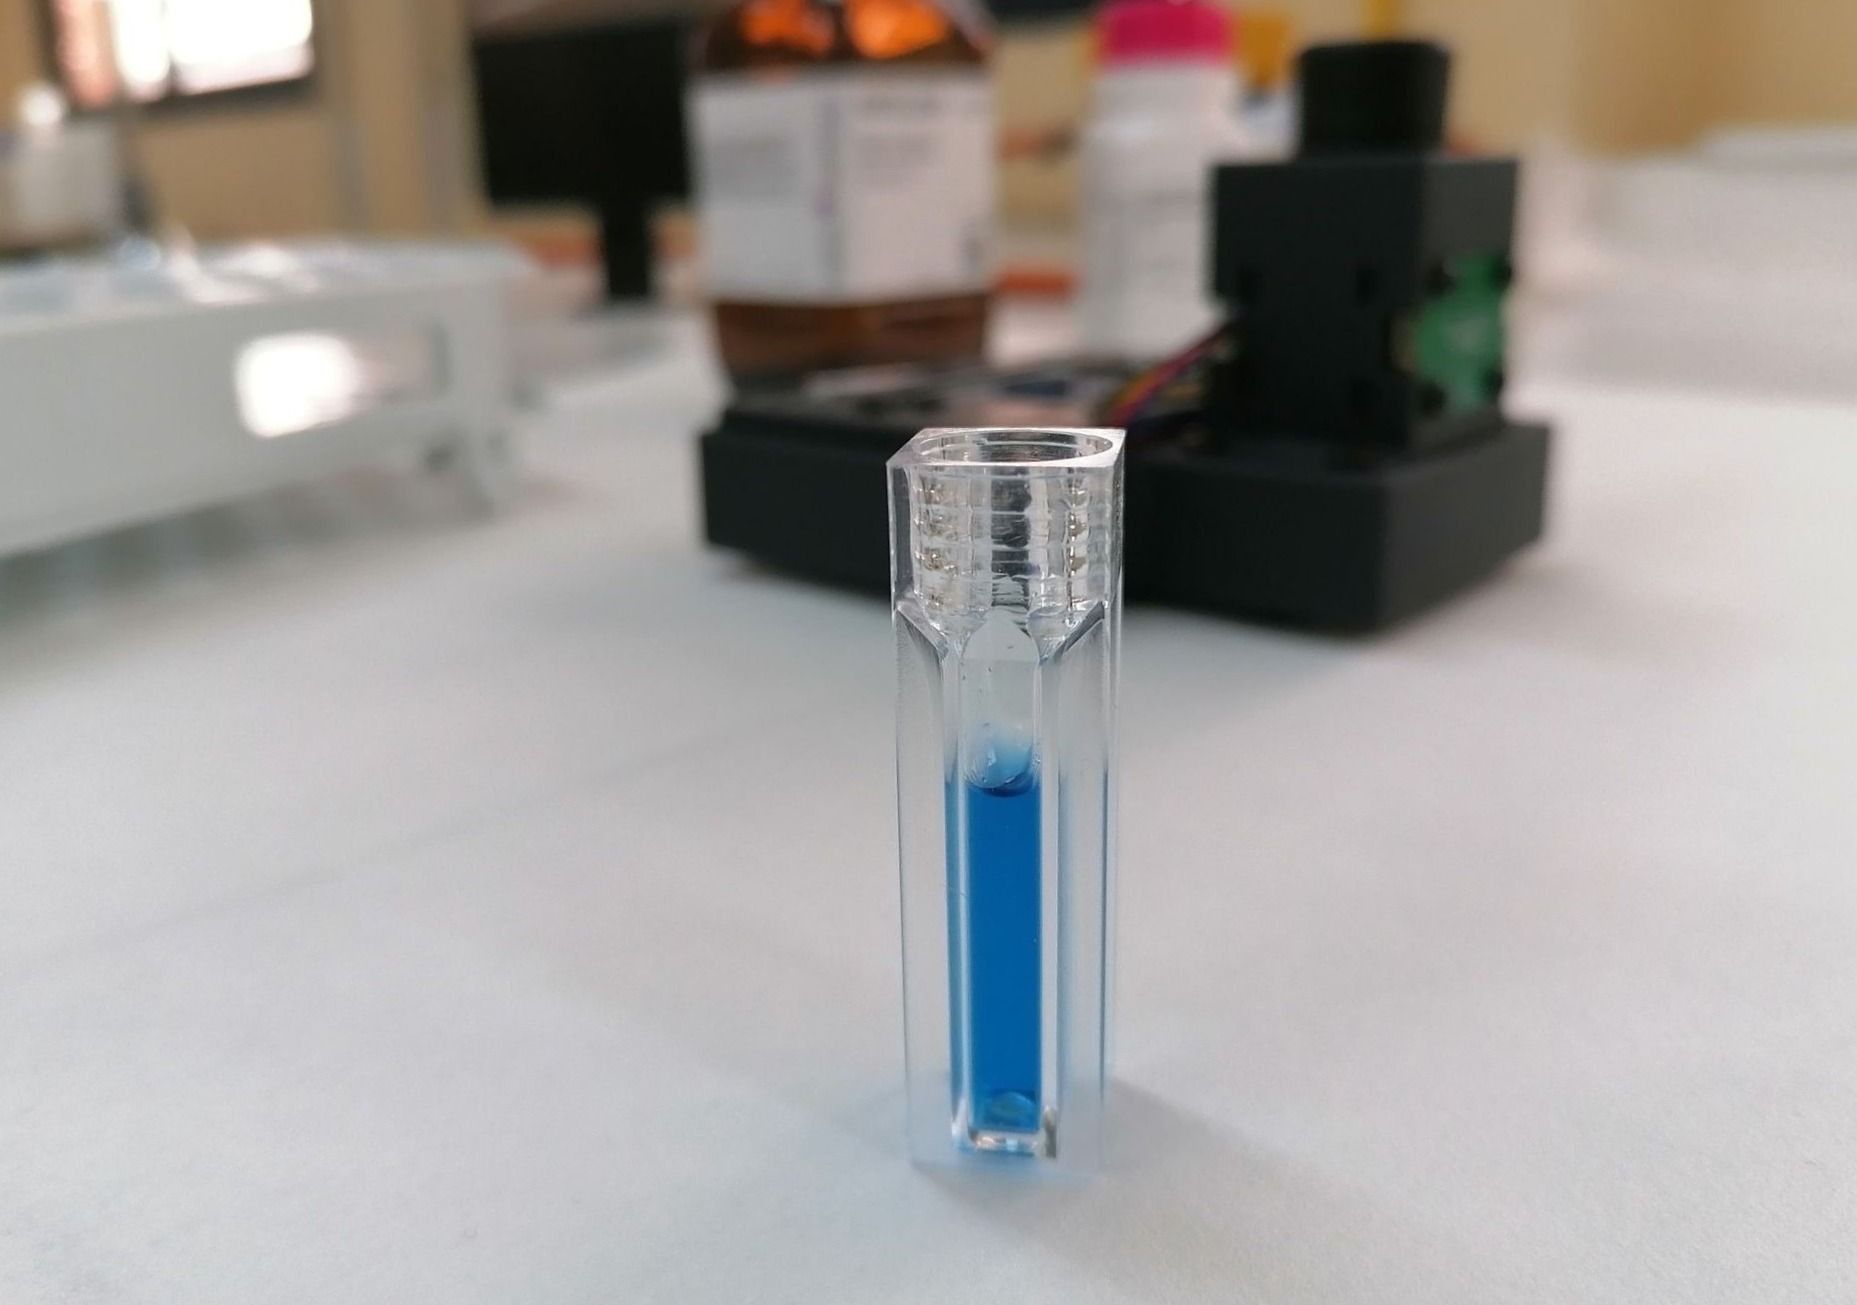
Part 1: Bradfords Protein Assay
Principle
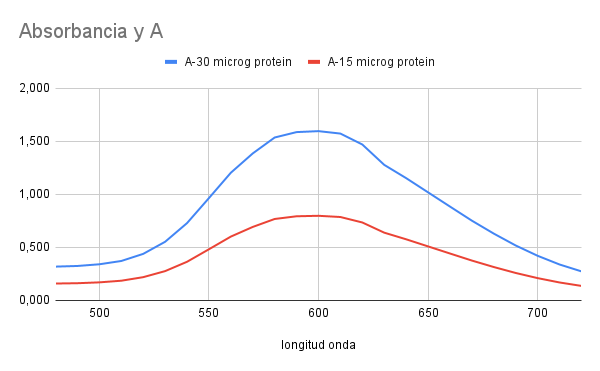
The Bradford protein assay is based on the observation that the absorbance maximum for an acidic solution of Coomassie Brilliant Blue G-250 shifts from 465 nm to 595 nm when binding to protein occurs.
Absorbance spectrum
- Reported values in literature around 595 nm
- Measured absorbance peak at 595 nm
- Open Colorimeter measurement LED: 595 nm
Materials
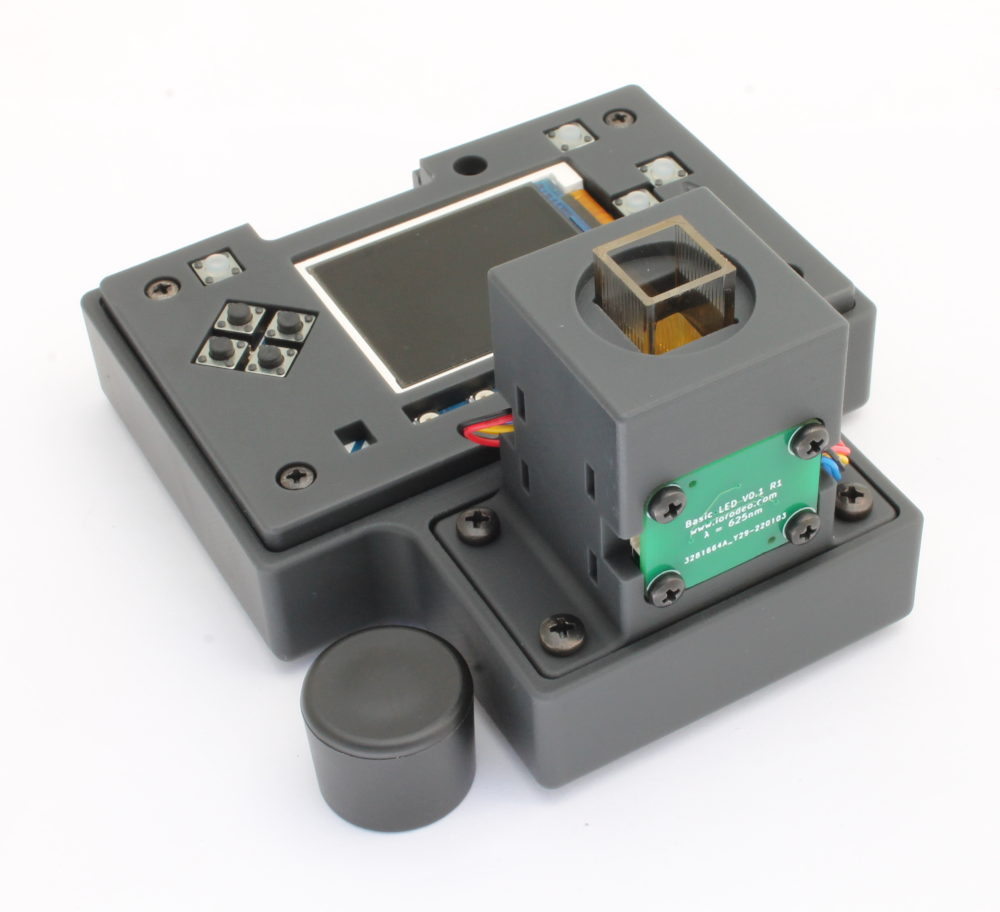
- Open Colorimeter with 595 nm LED board
- Bradford reagent and BSA standard
- Distilled water
- Cuvettes
- 1.5 mL microtubes
- 100 mL volumetric flask
- 100 µL adjustable micropipette
Prepare Bradford calibration solutions
- Prepare a stock solution of 1 mg/ml BSA in a 100 mL volumetric flask. Fill the line with distilled water
- Make a 10-fold dilution of the 1 mg/ml BSA stock for a working 100 µg/ml BSA standard
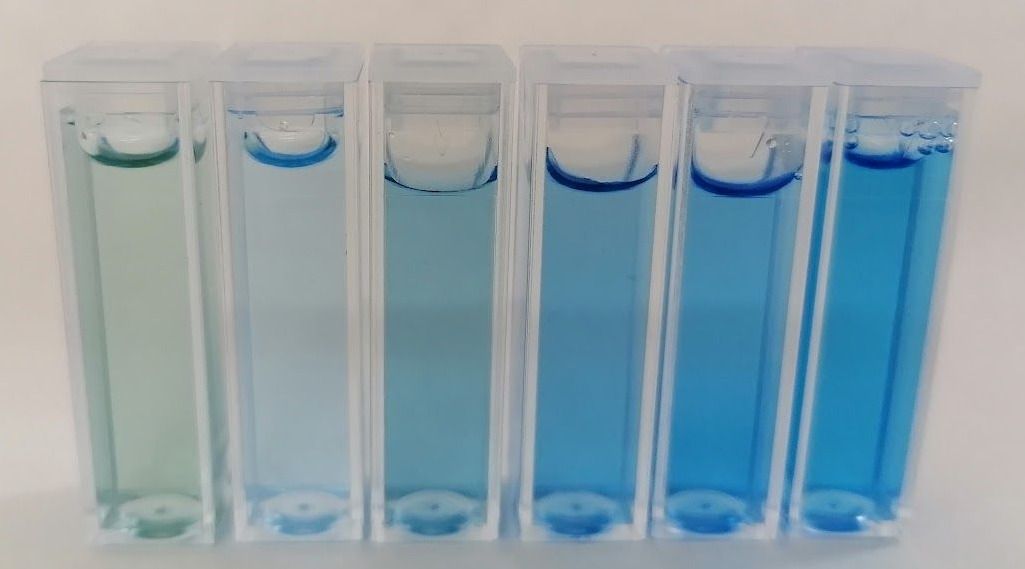
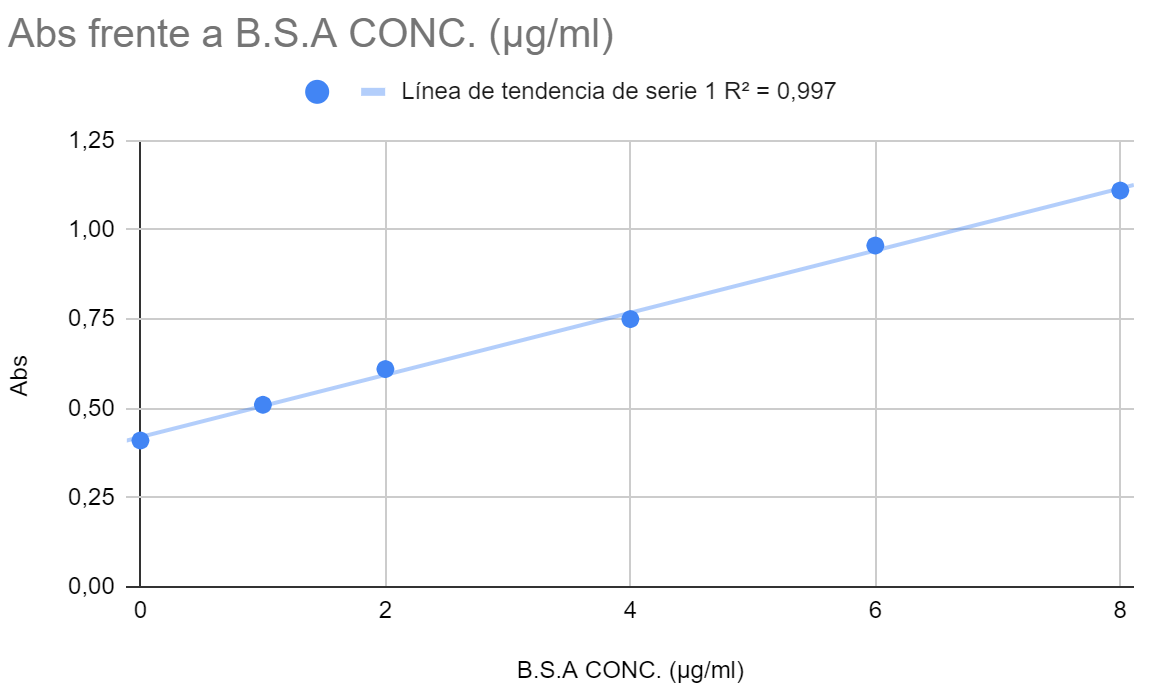
- Using the 1.5mL microtubes, prepare the calibration solutions as outlined in the table below
Method
- To each 100 µl sample, add 1 ml of Bradford reagent
- Wait at least 5 mins for the color to develop
- Make sure the Open Colorimeter has the 595 nm LED installed
- Turn on the Open Colorimeter and select absorbance
- Blank the colorimeter with distilled water
- Measure absorbance of all of the solutions
Part 2: Importing protein calibration data to Open Colorimeter
In this section we will import the Bradford protein assay calibration data into the Open Colorimeter so it can be easily accessed to measure protein concentrations in samples. To do this we will use the oc-calibration-app described in this guide:
The first step is to save the calibration data in a CSV file. We subtracted the absorbance from the zero concentration sample value from the other samples values in order to produce a plot that passes through (0,0). A file with the data is shown below.
The next step is to fill out the the oc-calibration app fields and upload the calibration .csv file:

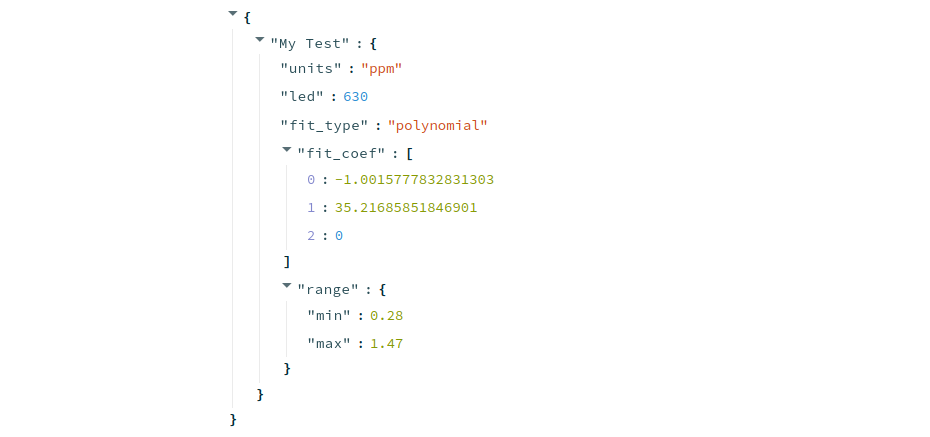
The app generates a plot to visually check the calibration data and .json code for the Open Colorimeter firmware.

{
  "Protein Assay": {
    "units": "ug/mL",
    "led": 595,
    "fit_type": "linear",
    "fit_coef": [
      112.15564695244164,
      0
    ],
    "range": {
      "min": 0,
      "max": 0.7
    }
  }
}
json code generated by the oc-calibration-app
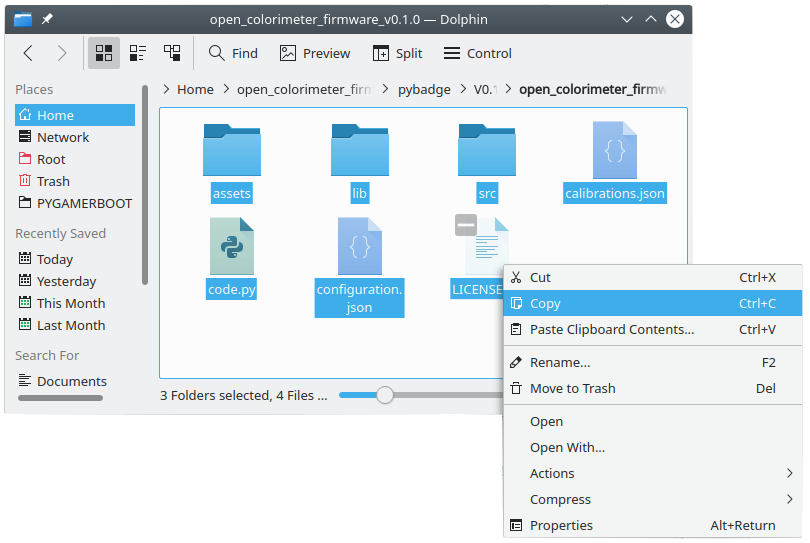
Copy/paste the .json code into the calibrations.json file on the Open Colorimeter and upload to the Open Colorimeter as described in this tutorial:
When using this calibration the colorimeter should be blanked with a zero concentration sample containing the Bradford reagent.
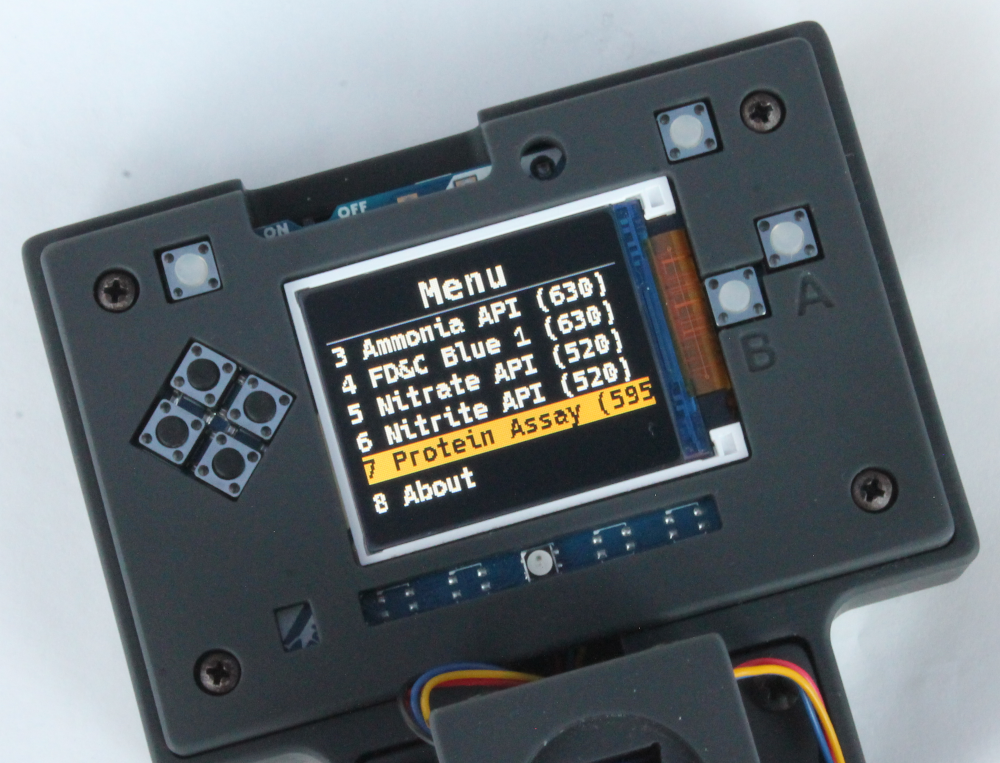
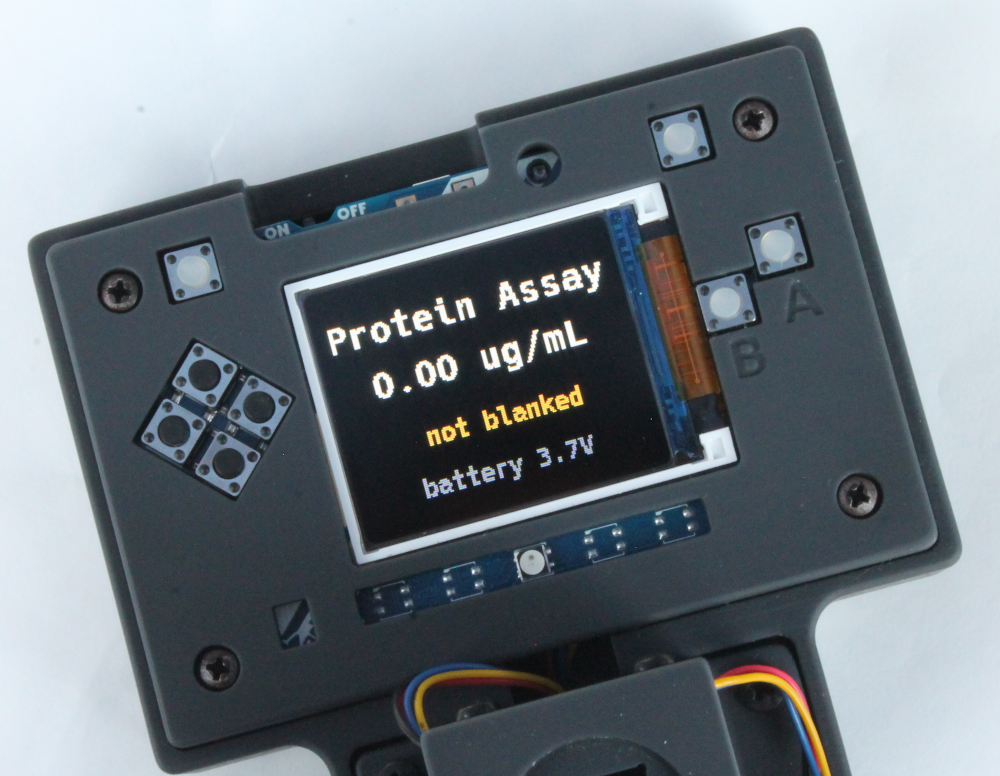
The main menu of your Open Colorimeter should now include the Protein Assay as shown in the images below. You can select this method from the menu along with the 595nm LED to measure protein concentrations in your sample using José and Eva's method.


Comments ()