Overview of Open Colorimeter calibration files
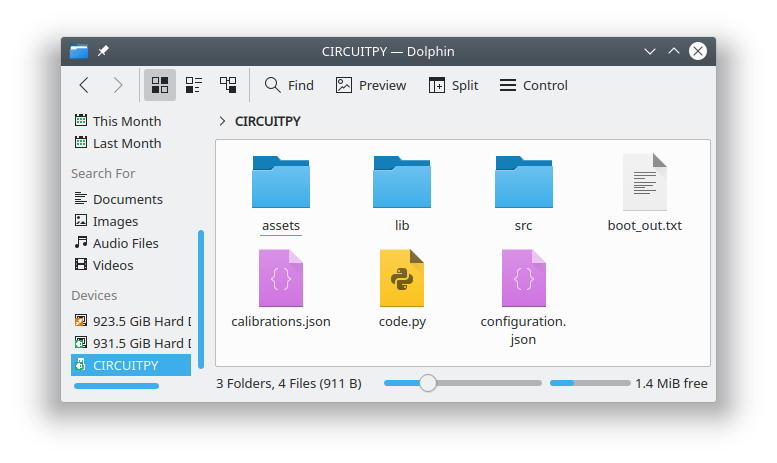
This page gives some more information on the calibrations.json file which is used to load custom calibrations onto the Open Colorimeter.
This file contains calibration data for measurements and the individual entries in this file become the tests which are displayed in the Open Colorimeter's menu. They are displayed after the default entries (Absorbance, Transmittance and Raw Sensor) in the menu. An example of the contents of this files is shown below.
{
  "Ammonia API": {
    "units": "ppm",
    "led": "630",
    "fit_type": "polynomial",
    "fit_coef": [
      1.0128521350438369,
      1.890930808804952,
      0.0
    ],
    "range": {
      "min": 0.0,
      "max": 2.0
    }
  },
  "FD&C Blue 1": {
    "units": "mg/L",
    "led": "630",
    "fit_type": "polynomial",
    "fit_coef": [
      9.657673193787982,
      0.0
    ],
    "range": {
      "min": 0.0,
      "max": 0.81
    }
  },
  "Nitrate API": {
    "units": "ppm",
    "led": "520",
    "fit_type": "polynomial",
    "fit_coef": [
      0.32039213453320625,
      34.032597696304,
      0.0
    ],
    "range": {
      "min": 0.0,
      "max": 1.47
    }
  },
  "Nitrite API": {
    "units": "ppm",
    "led": "520",
    "fit_type": "polynomial",
    "fit_coef": [
      0.13111937060865314,
      1.2591439203550079,
      0.0
    ],
    "range": {
      "min": 0.0,
      "max": 1.4
    }
  }
}
These are example data for demonstrating the structure of the calibrations file
The calibration file above contains four tests: Ammonia API, FD&C Blue 1, Nitrate API, and Nitrite API. At the top level the calibrations.json file consists of a JSON object where the keys are the names of the tests and the values associated with each are JSON objects containing the calibration data for the test as shown below.
{
  "Test1": { JSON object with Test1 calibration data },
  "Test2": { JSON object with Test2 calibration data },
  "Test3": { JSON object with Test2 calibration data }
}
The JSON object containing the calibration data for a test has five keys required keys: units, led, fit_type, fit_coef and range. An example is shown below.
{
  "units": "ppm",
  "led": "520",
  "fit_type": "polynomial",
  "fit_coef": [
    0.13111937060865314,
    1.2591439203550079,
    0.0
  ],
  "range": {
    "min": 0.0,
    "max": 1.4
  }
}
units:
A string specifying the units used for the measurement. This should be short, ideally 3-4 characters, and will be displayed on the Open Colorimeter's display after the measurement value when the test is running.
led:
A string indicating the wavelength or otherwise describing the led used for the test, e.g., "520" or "white". Again, this should be short as it will be diplayed after the test's name in the colorimeter's menu.
fit_type:
A string specifying the type of fit used by the calibration. Currently this, can be either "linear" or "polynomial".
fit_coef:
An array of floats specifying the fit coefficients. If the fit_type is "linear" then this array must have length=2. Whereas, if the the fit_type is "polynomial" the array length can be 2 or greater. The length of the array determines the order of the polynomial fit. If the length of the array is n+1 than the order of the polynomial is n. In the case that the array length is 2 the fit types "linear" and "polynomial" are equivalent and the order of the polynomial is 1. In the array the values of the polynomial coefficients are specified from highest to lowest power. As an example the array of fit coefficients for the polynomial
$$
p(x) = c_n x^n + c_{n-1} x^{n-1} + \cdots + c_1 x + c_0
$$
is given by
$$[c_n, c_{n-1}, \ldots, c_1, c_0 ] $$
The polynomial should specify a function which converts the absorbance values acquired by the colorimeter (the x's in the equation above) to the measurement quantity of interest, e.g, concentration in ppm. As a reference the polynomials used are here in the same format as that produced by the NumPy library's polyfit function or Matlab's polyfit function. In the CircuitPython firmware this array of coefficients is used by the numpy.ulab.polyval function to turn the absorbance value into the desired quantity.
range:
A JSON object specifying the allowed range for the test. This object has two keys: "min" and "max". An example is shown below.
{
  "min" : 0.0,
  "max" : 1.0
}
The allowed range is given in terms of absorbance. The minimum and maximum values in this object specify the absorbance for the minimum and maximum measurement quantities e.g. concentrations.
- min: the absorbance at the minimum of the measurement quantity range
- max: the absorbance at the maximum of the measurement quantity range
Calibration Tools
We have developed several tools which help automate the process of generating calibrations from sample data. A web-based app called oc-calibration-app and a command line program called oc-calibration. Either one can be used depending on the users preference. These are described in the following two pages:
 William Dickson
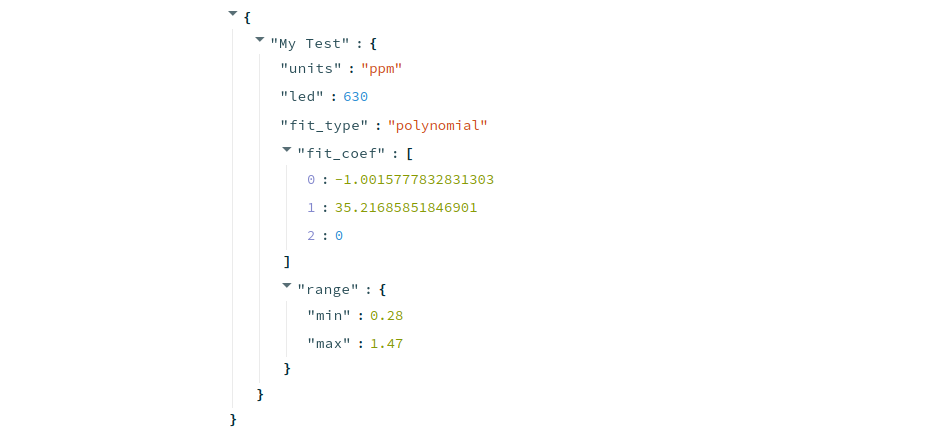 William Dickson
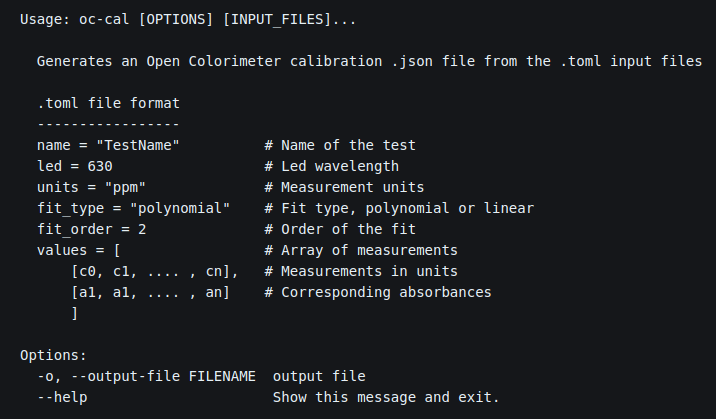

Open Colorimeter Product Guide
Documentation site for the Open Colorimeter, Multi-Channel Colorimeter, UV Open Colorimeter & Open Colorimeter Plus
Product Guide Home Page