Open Colorimeter hardware and testing
Open Colorimeter with Beer's Law experiments & measuring food dyes in drinks
This week we have some hardware updates for the Open Colorimeter. We also continued testing with three experiments described below including an assay to measure the concentration of blue food dye in beverages.
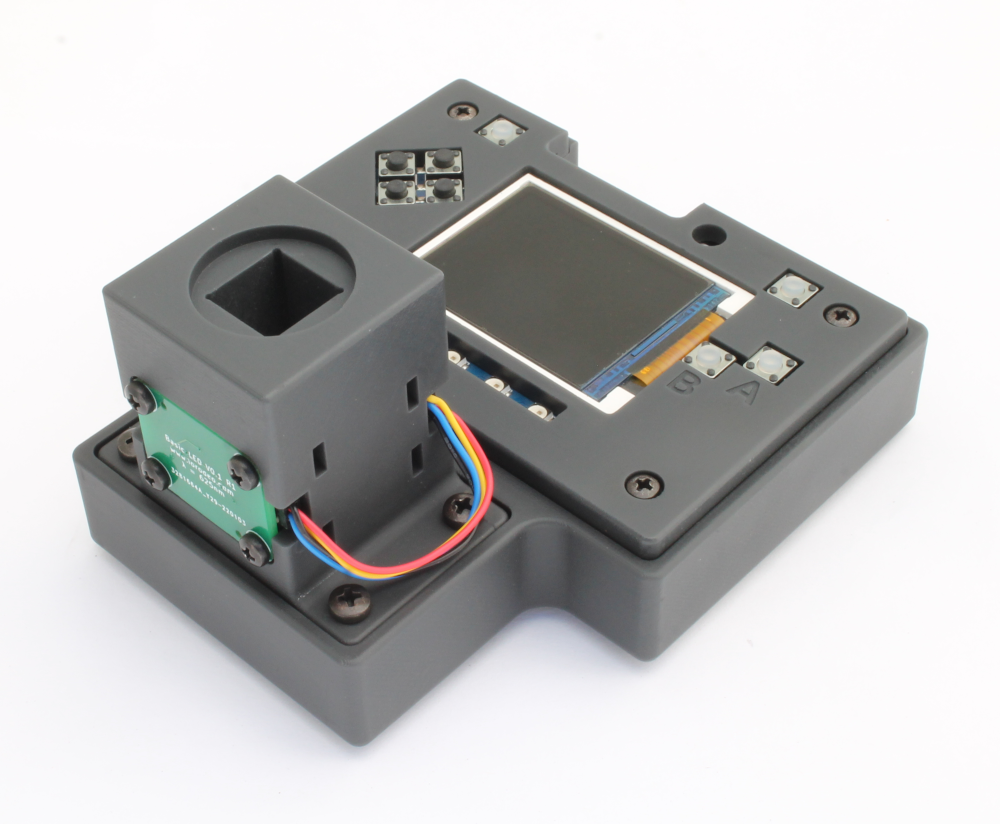
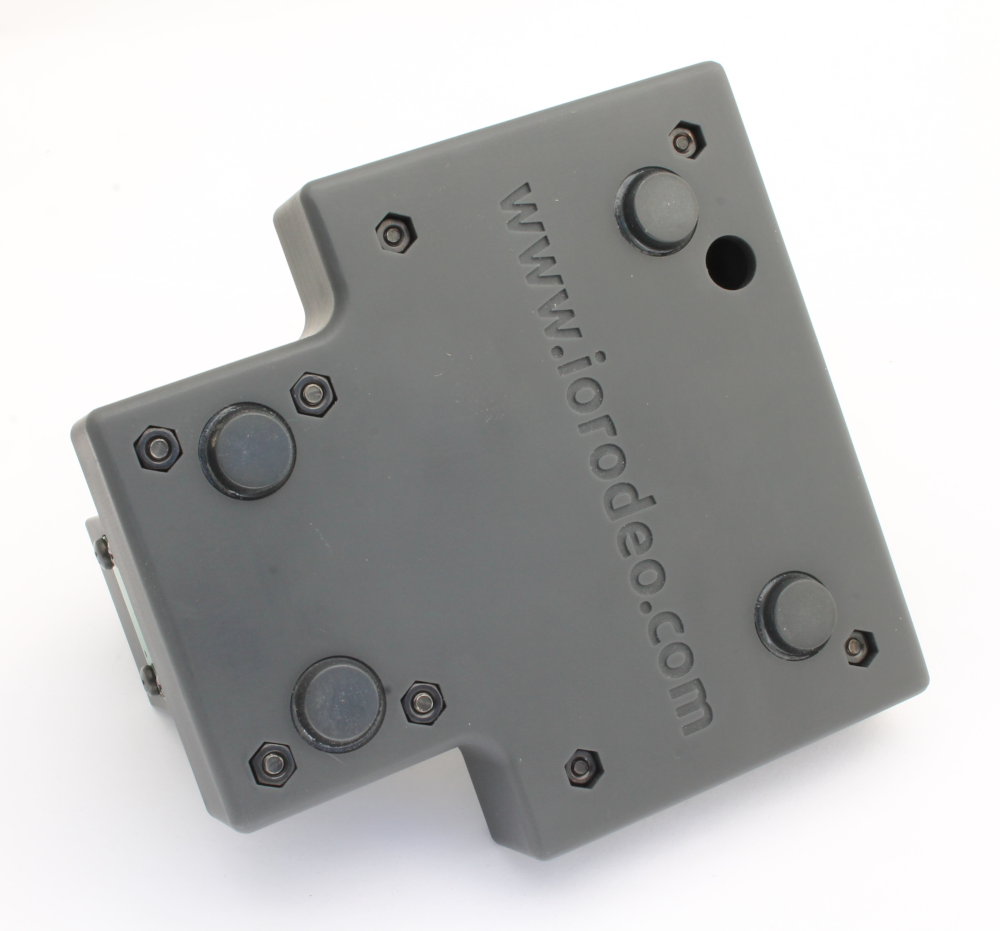
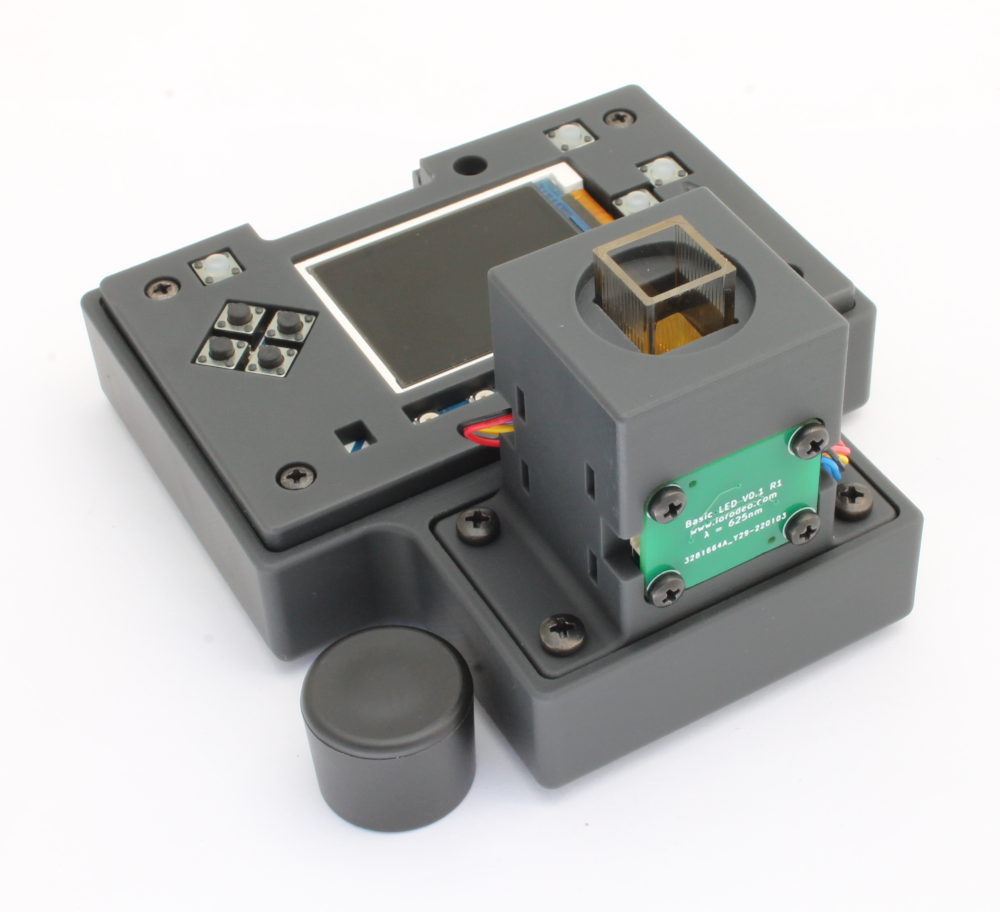
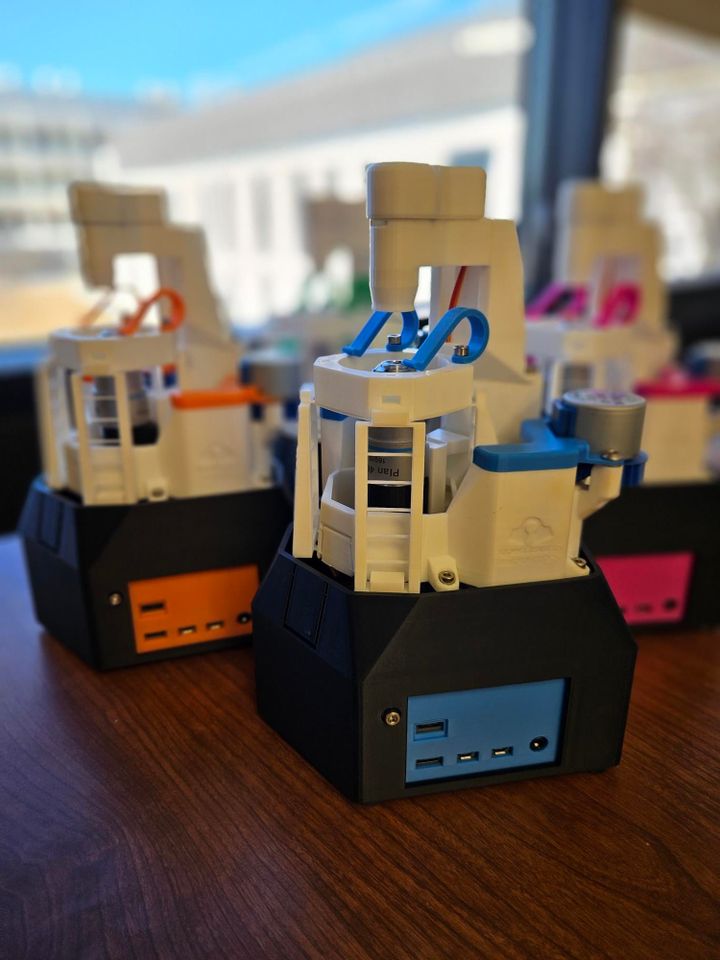
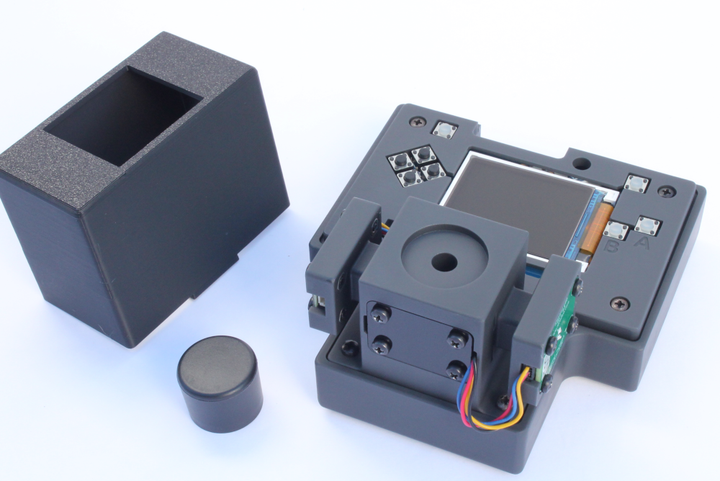
Final Hardware images
We have finalized the Open Colorimeter design and tested the prototypes. Some images are shown below. We love that this colorimeter is portable and easy to use. It is simplified, sturdy and standalone - perfect for lab benches and taking into the field. We have tested with standard cuvettes from BrandTech which all fit well, including the macro and semi-macro cuvettes and the Ultramicro UV cuvettes for 70 µL sample sizes.

Experiment 1: Beer's Law
Goal: Verify Open Colorimeter performance using food dyes as samples and testing three different LED options
When using a colorimeter to measure absorbance of a colored solution at it's peak absorbance (λmax) value, we should expect a linear relationship between absorbance and concentration. We wanted to verify this with the Open Colorimeter for each of the three LED wavelength options currently available: red (632nm), green (515nm) and blue (460nm). For this test we used the same food dye solutions used in the previous newsletter where we determined peak absorbance for each dye (λmax) using a spectrometer and a modified cuvette holder. In the same newsletter we also measured the peak wavelength (λpeak) for the LEDs used in the Open Colorimeter. With this information we can select the correct LED to use when measuring absorbance i.e. pair an LED with λpeak that most closely matches the samples λmax
- Red dye: λmax = 517nm --> Use green LED (λpeak @ 515nm)
- Blue dye: λmax = 626nm --> Use red LED (λpeak @ 632nm)
- Yellow dye: λmax = 454nm --> Use blue LED (λpeak @ 460nm)
Materials we used
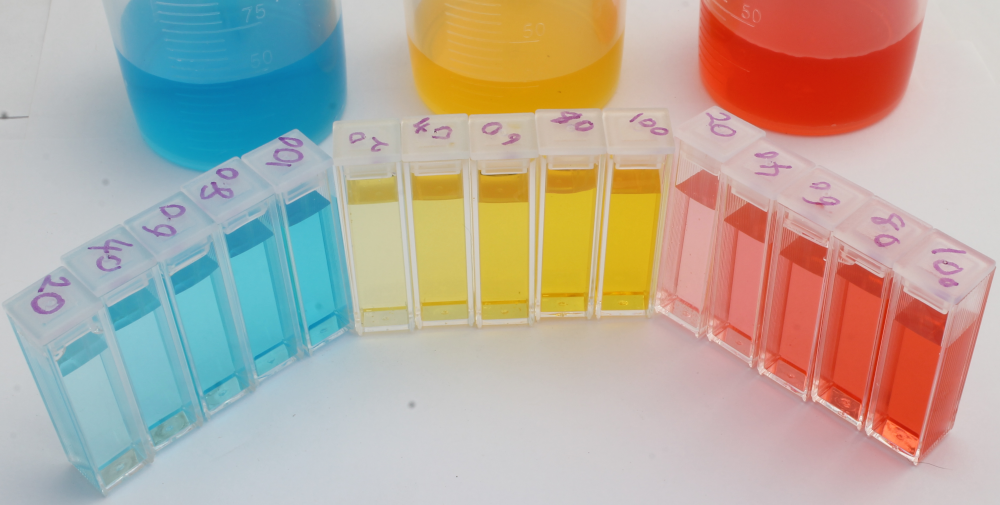
- Food dyes: Blue (FD&C Blue 1), Red (FD&C Red 40) and Yellow (FD&C yellow 5). We used this Assorted Food Coloring kit from Target but most grocery stores carry something similar. Although we do not have information on the concentration of each dye, for this test we can make a simple 0-100% dilution series.
- Open Colorimeter with 460nm, 515nm and 632nm LEDs
- BrandTech disposable PS macro cuvettes
- Distilled water (any grocery store)
- Glassware and pipettes
Each food dye was diluted with distilled water to an absorbance of approx. 1.0 at the appropriate wavelength (e.g. red dye measured with green LED). This was labelled the 100% sample. A series of dilutions was made from that 100% stock to prepare samples of 20%, 40%, 60% and 80% food dye. Absorbance was measured using the appropriate LED and results plotted.
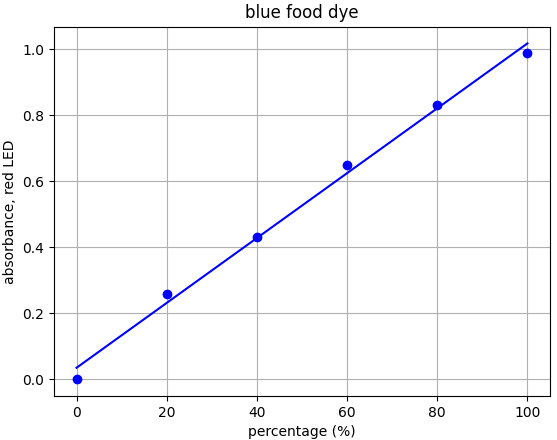
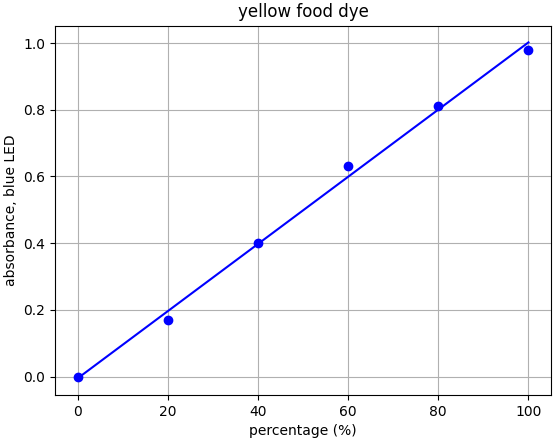
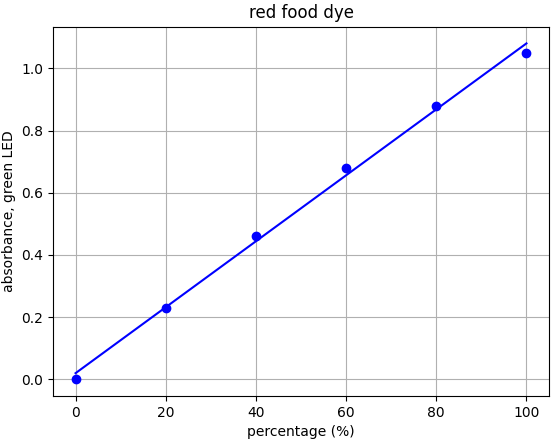
From the results for each dye we can see that there is a linear relationship for each dye-LED pair in the 0.0-1.0 absorbance range as we would expect to see.
Experiment 2: Experimental determination of Molar Extinction Coefficient
Goal: Use the Open Colorimeter to experimentally calculate the molar extinction coefficient of FD&C Blue #1
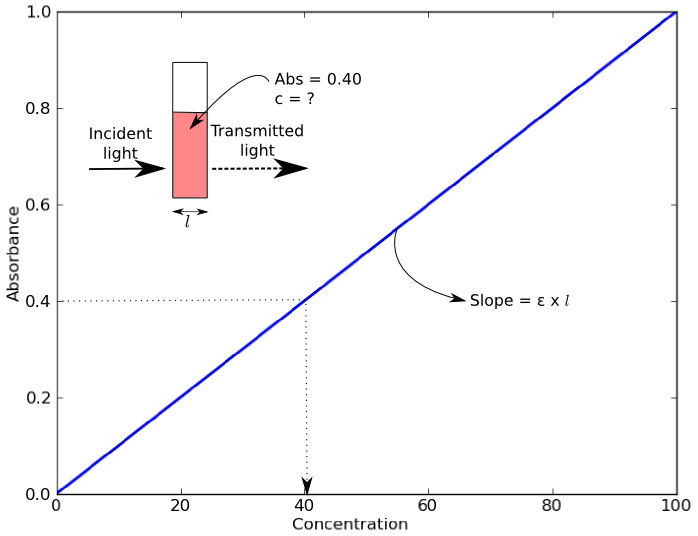
Beer’s Law states that absorbance of a sample (Abs) depends on the molar concentration (c), light path length in centimeters (l), and molar extinction coefficient (ε) for the dissolved substance at the specified wavelength (λ) as follows:
Molar extinction coefficient (also known as molar absorptivity or attenuation coefficient) is a measure of how strongly a substance absorbs light at a particular wavelength, and is usually represented by the unit M-1 cm-1 or L mol-1 cm-1.
An example of a Beer’s Law plot (concentration versus absorbance) is shown below. The slope of the graph (absorbance over concentration) equals the molar extinction coefficient, εl. As most cuvettes including the ones used in the Open Colorimeter have a 1cm pathlength,( l = 1cm) the slope = molar extinction coefficient.
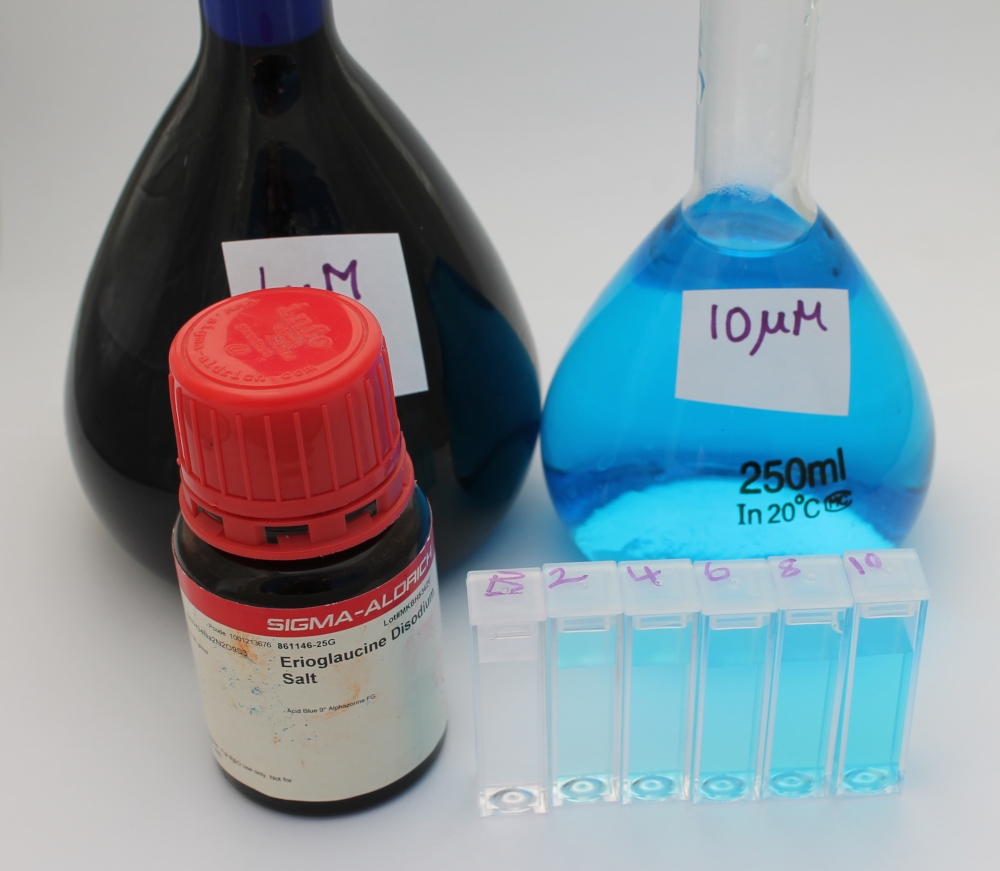
Blue food dye, FD&C Blue 1, is also commonly known as Brilliant Blue or Erioglaucine. It has a molar extinction coefficient at 625nm of 80,000 M-1 cm-1. As we already had Erioglaucine in powdered form we chose to use this to experimentally determine the molar extinction coefficient using the Open Colorimeter and compare this to the reported value of 80,000 M-1 cm-1.
Materials we used
- Erioglaucine Disodium Salt, Sigma Part # 861146-25G (MW: 792.85)
- Open Colorimeter with 632nm red LED
- BrandTech disposable PS macro cuvettes
- Distilled water (any grocery store)
- Glassware and pipettes
- Measuring scale
Method
- Weigh out 0.396 g of erioglaucine and place in 500 mL volumetric flask. Fill to line with distilled water and label 1mM stock
- Transfer 2.5 mL of the 1mM stock into a 250 mL volumetric flask. Fill to line with distilled water and label 10 µM working stock
- From the 10 µM working stock, prepare 2 µM, 4 µM, 6 µM and 8 µM solutions
- Blank the Open Colorimeter with a distilled water cuvette and measure absorbance of all samples using the red led (632nm)
- Plot data and find the slope with plotting tool of your choice. We are using Matplotlib
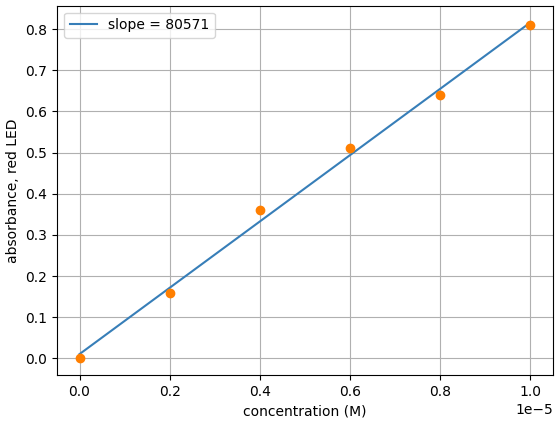
From the slope, we can see the measured molar extinction coefficient for erioglaucine with the Open Colorimeter is 80,571 M-1 cm-1. This is a difference of just 0.7% from the reported value of 80,000 M-1 cm-1.
Experiment 3: Determine the concentration of FD&C Blue 1 with the Open Colorimeter
Using Beer's Law and the measured molar extinction coefficient (ε), we can use the following equation to determine concentration of Blue 1 in a solution (e.g. sports drink) from absorbance measured at 632nm:
Materials we used
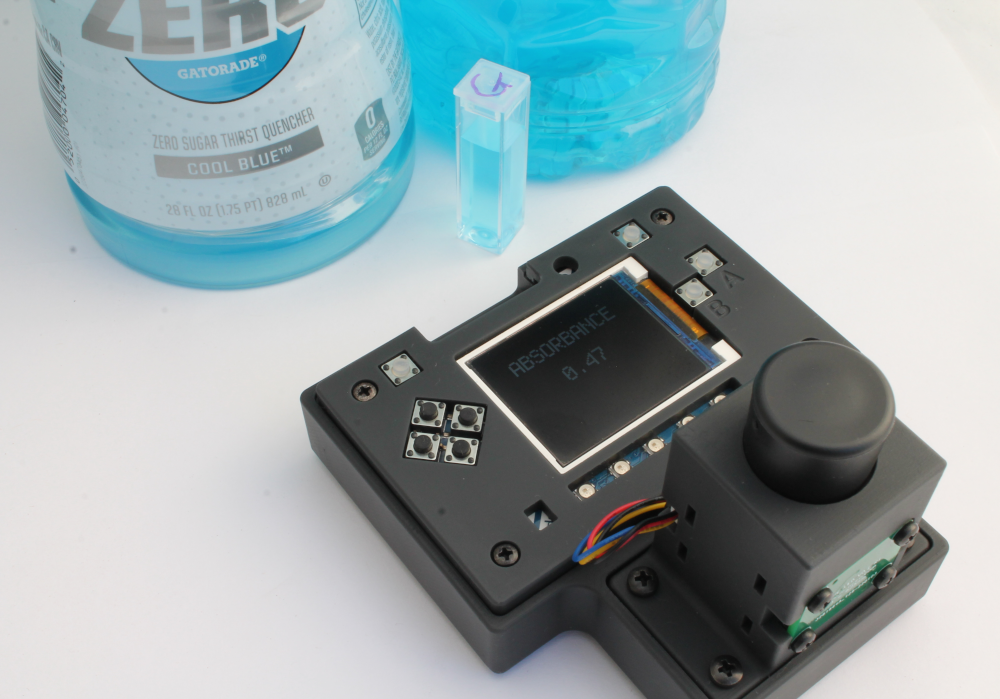
- Powerade Mountain Berry Blast and Gatorade Zero Cool Blue
- Open Colorimeter with 632nm red LED
- BrandTech disposable PS macro cuvettes

Results
A sample of each drink was poured into a cuvette and absorbance measured at 632nm. Neither sample needed dilution.
- Mountain Berry Blast: Abs = 0.46-0.47; Concentration = 5.7-5.8 µM
- Cool Blue: Abs = 0.49-0.51; Concentration = 6.1-6.3 µM
Using the molecular weight of Blue # 1 (792.85) we can convert this to mg/L:
- 5.75 µM Mountain Berry Blast = 4.56 mg/L (or 3.8 mg per 828 mL bottle)
- 6.2 µM Cool Blue = 4.92 mg/L (or 4.1 mg per 828 mL bottle)
Try it at home
As we know the molar extinction coefficient of other food dyes, you can try this with other food dyes and beverages. Just check the label for which dyes are added and follow the steps above to determine absorbance at the appropriate wavelength. Look up the reported molar extinction coefficient (ε) and use the molecular weight to convert this to mg/L. Below are details for two other commonly used food dyes, Red 40 and Yellow 5, to get you started!
- Red 40 (aka Allura Red AC): MW = 496.42, ε = 25,900 M-1cm-1 at 504 nm
- Yellow 5 (aka Tartrazine): MW = 534.36; ε = 20,330 L mol-1 cm-1 at 472 nm
Comments ()